
NtTimeChartControl.SheetLeftDt Property
The NtTimeChartControl covers the time range from year 0 to year 9999. But it does not display the entire range at once. Instead it picks a certain range out of
that large time span and prepares it for display. This certain range is called 'sheet' because it is like a huge sheet of paper where all data objects that cover the sheet's area are being drawn on. The sheet
is bigger than what you see on the screen both in vertical and horizontal direction. For this reason you can move around the sheet by scrolling horizontally and vertically (or even drag the sheet with the mouse).
In vertical direction the sheet is limited by the first and the last data row. In horizontal direction the sheet is limited by certain time stamps called
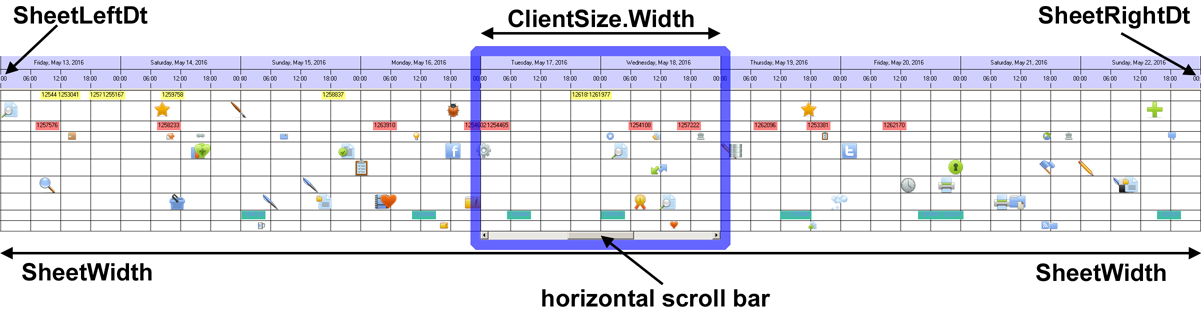
Scrolling to the left or right moves the sheet accordingly. Once you reached the end of the sheet, the NtTimeChartControl sets up a new sheet that aligns perfectly
with the position of the old one so you can go on scrolling even further.
This property
Overload List:
| Modifier / Return Value | Name and Parameters | Description |
|---|---|---|
|
|
|
The time stamp of the left edge of the sheet. Read only. |
Return value:
The time stamp of the left edge of the sheet.
Remarks:
It is important to know that the time span between left and right edge of the sheet may vary in rare cases: Think about a Time Chart that is set up for one hour per column. When daylight saving time switches, one day might be one hour longer or shorter.
See also: