Nateo Tutorial: Custom Object Drawing
In this tutorial we will implement the drawing of certain objects by ourselves instead of letting the NtTimeChartControl do the drawing. In order to keep things simple, we will set up a very
tiny application that has only one row in its Time Chart and we will add data of only one type. For this type of data we will implement the drawing.
The idea is that our data may consist of floating point values ranging from 0.0 to 1.0. Each data object shall be displayed by a filled circle and the radius of the circle indicates the value of the item:
The radius shall range from 0 (for value 0.0) to maxRadius (for value 1.0). Here we want to go the more professional way: Instead of simply hardcode maxRadius
we want to determine it in the same way as other properties of the display like fonts and colors. For this purpose we will extend the NtDisplayDef data type in a subclass which is
able to store the maxRadius.
1. Preparing the application
Starting with an empty application as outlined in the first tutorial Empty Time Chart, the code for the Form1_Load() member method will by now look
quite common to you:
ntTimeChartControl.Init(10 * 24, 90, TimeDisplayMode.hours);
ntTimeChartControl.SetScrollBars(ntTimeChartControlHScrollBar, ntTimeChartControlVScrollBar);
ntHeaderControl.Init(ntTimeChartControl, Font, Font, false);
ntLeftFlankControl.Init(ntTimeChartControl, null, ntLeftFlankControl.ClientSize.Width);
ntBackPanel.SetPadding(2, 2, 2, 2);
ntBackPanel.Repos(ntLeftFlankControl, ntTimeChartControl, ntTimeChartControlHScrollBar, ntTimeChartControlVScrollBar);
ntTimeChartControl.ScrollToDt(DateTime.Now, ntTimeChartControl.ClientSize.Width / 2, 0);
ntTimeChartControl.Focus();
2. Define our own Data Type
To make the tutorial look more professional we choose the way of defining our own data type to store the floating point value:
public class MyDataObject : NtDataObject
{
public double d;
public MyDataObject(double _d, ulong _objId, DateTime _dt) { d = _d; dataItem = _d; objId = _objId; dt = dtEnd = _dt; dataTypeId = 100; }
}
3. Define our own subclass of NtDisplayDef
Instead of simply hard coding the maxRadius we want to take it from our configured NtDisplayDef. Therefore we create our own subclass:
public class MyDisplayDef : NtDisplayDef
{
public int maxRadius;
public MyDisplayDef() { dataTypeId = 100; displayMethod = 300;}
}
Please note two things here: First, in its constructor MyDisplayDef defines the same dataTypeId which is defined in the constructor of
MyDataObject: 100. This links both of them together, because whenever the NtTimeChartControl finds a data object with this data type it knows which
display definition is the right one. Second, the displayMethod is set to 300, which is greater than 100 which means 'Custom Drawing'. So when finding a data object with dataTypeId
100, the Time Chart will look for an instance of NtDisplayDef with 100. Finding one, it will read displayMethod 300 from it and then know that for this
data object it has to call the interface methods of custom drawing.
4. Implement the interface NtCustomObjectPaint
The most important part is to implement the interface NtCustomObjectPaint. By this interface the NtTimeChartControl calls our code to perform the following
tasks:
- Create NtDisplayObjects for those NtDataObjects that are defined to be custom drawn.
- Draw the NtDisplayObjects we created.
- Calculate the Tick values for the left and right edge of the data object.
- Calculate the left and right edges of the NtDisplayObjects within the current sheet of the NtTimeChartControl.
- Calculate the top and bottom edges of the NtDisplayObjects within their row.
For each of these tasks there is a member function on its own defined by the interface. In our example, the data object will contain the value as a double number. The display object
meanwhile will be the circle with the radius determined by the value. The NtDisplayObject always represents the bounding rectangle for the visual representation, so in our case it
will be a square with the edges two times the radius of our circle. As we want the centers of all circles to be aligned on one horizontal line, we will calculate the top and bottom accordingly.
We will let our Form implement this interface, so we add the following member functions to our Form1 class:
//Custom Object Paint Interface Implementation
public NtDisplayObject NtCreateDisplayObject(NtTimeChartControl ntTimeChartControl, NtDataObject dataObject, NtDisplayDef displayDef, Graphics g)
{
return new NtDisplayObject();
}
public void NtPaintCustomObject(NtTimeChartControl ntTimeChartControl, NtDisplayObject displayObject, Rectangle objectRect, Rectangle paintRect, Graphics g)
{
g.FillEllipse(displayObject.Selected?Brushes.LightBlue:displayObject.DisplayDef.foregroundBrush, objectRect);
}
public void NtCalculateLeftAndRightEdgesTicks(NtTimeChartControl ntTimeChartControl, NtDataObject dataObject, NtDisplayDef displayDef, double ticksPerPixel, out long leftTicks, out long rightTicks)
{
int maxRadius = ((MyDisplayDef)displayDef).maxRadius;
double d = ((MyDataObject)dataObject).d; ;
int radius = (int)(d * maxRadius + 1);
long radiusInTicks = (long)(ticksPerPixel * radius);
leftTicks = dataObject.dt.Ticks - radiusInTicks;
rightTicks = dataObject.dt.Ticks + radiusInTicks;
}
public void NtCalculateLeftAndRightEdgesInSheet(NtTimeChartControl ntTimeChartControl, NtDisplayObject displayObject, long sheetLeftTicks, double pixelPerTick, out int left, out int right)
{
int maxRadius = ((MyDisplayDef)displayObject.DisplayDef).maxRadius;
double d = ((MyDataObject)displayObject.DataObject).d;
int radius = (int)(d * maxRadius + 1);
left = (int)((displayObject.DataObject.dt.Ticks - sheetLeftTicks) * pixelPerTick) - radius;
right = left + 2 * radius;
}
public void NtCalculateTopAndBottomInRow(NtTimeChartControl ntTimeChartControl, NtDisplayObject displayObject, out int top, out int bottom)
{
int maxRadius = ((MyDisplayDef)displayObject.DisplayDef).maxRadius;
double d = ((MyDataObject)displayObject.DataObject).d;
int radius = (int)(d * maxRadius + 1);
top = displayObject.DisplayDef.preferredRowHeight / 2 - radius;
bottom = top + 2 * radius;
}
Of course we need to declare to the NtTimeChartControl that our form implements the interface. So the header of our class shall look like this:
public partial class Form1 : Form, NtCustomObjectPaint
{
...
}
And in our Form1_Load() method we need to append:
ntTimeChartControl.customObjectPaint = this;
5. Create the instance of our Display Definition and a Perspective
In our Form1_Load() method we now add the code to instantiate the Display Definition of our own type and also create the Perspective with only one row. That row will hold one data type,
only, which is our self defined one with dataTypeId 100.
MyDisplayDef mdd = new MyDisplayDef() { foregroundBrush = Brushes.Orange, maxRadius = 10, preferredRowHeight = 30 };
ntTimeChartControl.SetDisplayDef(mdd);
NtPerspective perspective = new NtPerspective();
NtRowPerspective rp = new NtRowPerspective() { rowHeight = 30 };
rp.dataTypeIds.Add(100);
perspective.rowPerspecives.Add(rp);
ntTimeChartControl.SetNtPerspective(perspective);
6. Create the data and put it to the Time Chart
Finally we create our data set and put it to the Time Chart:
List dataObjects = new List(10);
DateTime now = DateTime.Now;
Random random = new Random((int)(now.Ticks % 100000));
ulong objId = 1;
for (int i = 10; i-- > 0;) dataObjects.Add(new MyDataObject(random.NextDouble(), objId++, now.AddMinutes(random.Next(120 * 6) - 60 * 6)));
ntTimeChartControl.SetData(dataObjects);
Discussion
Starting the application you should see something like this:
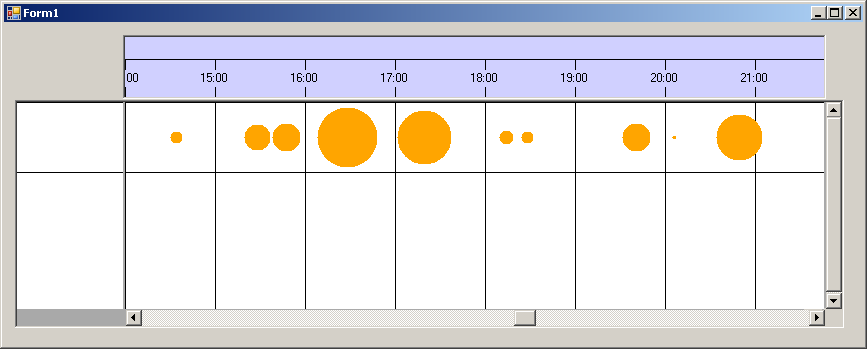
In this example we even have not defined a Row Header, so we have no legend for our data. Anyway the data objects work fine in terms of tooltips, movability etc. So they act as any other objects within the
NtTimeChartControl.
Please note that in the NtPaintCustomObject we use the Selected property of the NtDisplayObject to determine the color of the filled circle
in order to reflect its selection status.
This tutorial of course is one of the more complex ones. But once you understand implementing the interface, things are pretty straight forward and you can implement the code for various custom drawn object
types efficiently.
Back to Overview
