Nateo Tutorial: Categories
Categories are a good technique to organize the rows of your Time Chart into groups and subgroups. In order to demonstrate the correct implementation of categories, we will create a Time Chart with many rows
(data and display definitions loaded from files), and set up the Perspecitve in a way that on startup there are no categories while after pressing a button categories will be added.
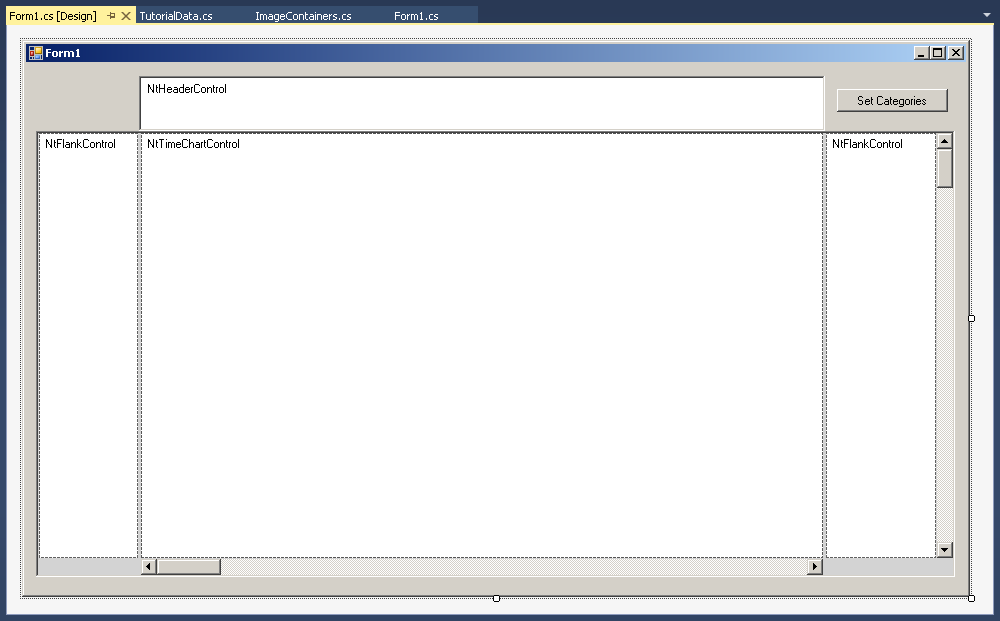
To start, please create an application with two Flank Controls in a way that it looks like this in the designer (please note the additional button on the top right):
1. Preparing the application
First add the file 'MyNtApplication.cs' to your project. The class in there will act as implementation of the NtApplication interface.
Then add the following members to your Form class:
List<NtDisplayDef> displayDefs;
List<NtDataObject> dataObjects;
NtPerspective perspective;
MyNtApplication myNtApplication = new MyNtApplication();
Next add the file 'TutorialData.cs' to your project. The class TutorialData will help us to load data and Display Definitions from the demo files provided in this package.
Then let your Form1_Load() method look like this:
private void Form1_Load(object sender, EventArgs e)
{
ntTimeChartControl.SetNtApplication(myNtApplication);
ntTimeChartControl.Init(10 * 24, 90, TimeDisplayMode.hours);
ntTimeChartControl.SetScrollBars(ntTimeChartControlHScrollBar, ntTimeChartControlVScrollBar);
ntHeaderControl.Init(ntTimeChartControl, Font, Font, false);
ntLeftFlankControl.Init(ntTimeChartControl, null, ntLeftFlankControl.ClientSize.Width);
ntRightFlankControl.Init(ntTimeChartControl, null, ntRightFlankControl.ClientSize.Width);
ntBackPanel.SetPadding(2, 2, 2, 2);
ntBackPanel.Repos(ntLeftFlankControl, ntRightFlankControl, ntTimeChartControl, ntTimeChartControlHScrollBar, ntTimeChartControlVScrollBar);
ntTimeChartControl.ScrollToDt(new DateTime(2016,11,15,12,0,0).ToUniversalTime(), ntTimeChartControl.ClientSize.Width / 2, 0);
ntTimeChartControl.Focus();
//Load SampleData
Graphics g = CreateGraphics();
string workingDirectory = "..\\..\\..\\..\\..\\DemoData\\"; //adapt this accordingly to the path where the 'data' directory is located
myNtApplication.bitmapDirectory = workingDirectory + "images\\";
TutorialData.LoadIconsFromDir(myNtApplication.iconDict, workingDirectory + "icons\\", g);
if (myNtApplication.iconDict.Count == 0) MessageBox.Show("Error: No icons found!");
displayDefs = TutorialData.LoadDisplayDefsFromFile(workingDirectory + "displayDefs.txt");
perspective = TutorialData.LoadPerspectiveFromFile(workingDirectory + "perspective_08.txt");
dataObjects = TutorialData.LoadDataObjectsFromFile(workingDirectory + "dataObjects.txt");
//Put Display Definitions and Row Headers to Time Chart
for (int i = 0; i < displayDefs.Count; ++i)
{
NtDisplayDef dd = displayDefs[i];
ntTimeChartControl.SetDisplayDef(dd);
NtRowHeader rh = new NtRowHeader();
rh.InitRowHeaderText(dd.rowHeaderStr, Font, dd.textBrush, dd.bkBrush, g);
ntTimeChartControl.SetRowHeader(dd.dataTypeId, rh);
}
//Put the data to the Time Chart and set the current Perspective
ntTimeChartControl.SetNtPerspective(perspective);
ntTimeChartControl.SetData(dataObjects);
}
2. Creating the category rows
The category rows basically are regular rows. The only difference is that they have a categoryLevel less than the maximum. Example: In this tutorial we want to have two category levels.
For this reason all rows that contain data shall have the categoryLevel 2, while the category rows have a lower categoryLevel (0 for the topmost categories and
1 for the subcategories).
For this reason, the first step now is to make all data rows have the categoryLevel 2. The categoryLevel of a row is stored in the
NtRowPerspective of that row. So in the following code we will sweep through all NtRowPerspectives in the Perspective and set their
CategoryLevel to 2.
The second step then will be to insert new rows by inserting new NtRowPerspectives into the Perspective. These new rows will have categoryLevels 0 and 1 and
even categoryTexts.
Finally we will put the Perspective into the ntTimeChart (as this always clones the NtPerspective to store it).
All in all out button click handler looks like this:
private void button1_Click(object sender, EventArgs e)
{
foreach (NtRowPerspective rp in perspective.rowPerspecives) rp.categoryLevel = 2; //we want 2 levels of categories, so we first set all existing rows on level 2:
NtRowPerspective categoryRow1 = new NtRowPerspective() { rowHeight = 36, categoryLevel = 0, categoryText = "First Category" };
perspective.rowPerspecives.Insert(0, categoryRow1);
NtRowPerspective subCategoryRow1 = new NtRowPerspective() { rowHeight = 26, categoryLevel = 1, categoryText = "First Subcategory" };
perspective.rowPerspecives.Insert(1, subCategoryRow1);
NtRowPerspective subCategoryRow2 = new NtRowPerspective() { rowHeight = 26, categoryLevel = 1, categoryText = "Second Subcategory" };
perspective.rowPerspecives.Insert(8, subCategoryRow2);
NtRowPerspective categoryRow2 = new NtRowPerspective() { rowHeight = 36, categoryLevel = 0, categoryText = "Second Category" };
perspective.rowPerspecives.Insert(17, categoryRow2);
NtRowPerspective subCategoryRow3 = new NtRowPerspective() { rowHeight = 26, categoryLevel = 1, categoryText = "Third Subcategory" };
perspective.rowPerspecives.Insert(18, subCategoryRow3);
NtRowPerspective subCategoryRow4 = new NtRowPerspective() { rowHeight = 26, categoryLevel = 1, categoryText = "Fourth Subcategory" };
perspective.rowPerspecives.Insert(24, subCategoryRow4);
ntTimeChartControl.SetNtPerspective(perspective);
ntTimeChartControl.categoryTextBrushes = new Brush[2]; //you must initialize the array to the appropriate size
ntTimeChartControl.categoryTextBrushes[0] = Brushes.DarkBlue;
ntTimeChartControl.categoryTextBrushes[1] = Brushes.Blue;
ntTimeChartControl.categoryFonts = new Font[2]; //you must initialize the array to the appropriate size
ntTimeChartControl.categoryFonts[0] = new Font("Microsoft Sans Serif", 12, FontStyle.Bold);
ntTimeChartControl.categoryFonts[1] = new Font("Microsoft Sans Serif", 10, FontStyle.Bold);
ntRightFlankControl.ShowCategoryTexts = false;
button1.Enabled = false;
}
Please note that in addition we set one new font per category level.
And one final obstacle to note: For the right Flank Control we set ShowCategoryTexts to false. This prevents the right Flank Control from drawing the texts. Please set it to true and see the
difference.
In most cases you will have only one Flank Control (mostly to the left of the Time Chart) and then there is nothing to think about. But if you have more (like
in this example) it is good style to display the texts only on the leftmost FlankControl.
Now this is how the application finally looks like:
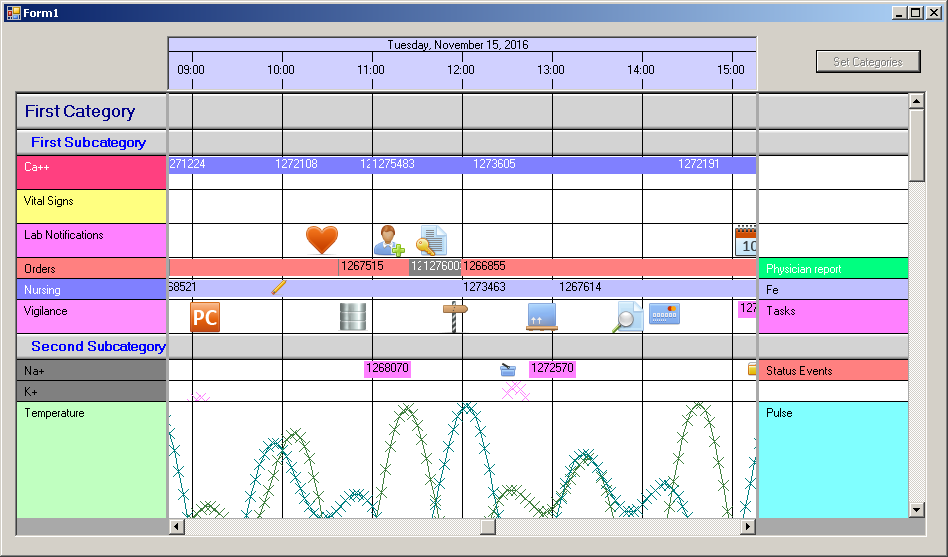
Remark
In this example we loaded the initial Perspective from a file. In the button click handler we modified this perspective by program code to show the details of the changes. In a more professional application you
will rather load all Perspectives from various files. Then you do not need such a big program code like in this example to create the categories.
Applications often offer various Perspectives to switch between in order to offer different views on the data.
Back to Overview
