
NtCustomObjectPaint.NtCalculateLeftAndRightEdgesInSheet Method
The sheet of the NtTimeChartControl is the panel the objects are drawn on and that you move around by scrolling. Scrolling completely to the left brings the left edge
of the sheet into sight, scrolling to the right the right one.
The left end of the sheet is placed ad a certain time stamp. In other words, the sheet starts at a certain time. This time correspond to sheet coordinate X=0. An object located five minutes later might have coordinate
X=20 or X=5 or whatever, depending on the time scale factor the NtTimeChartControl currently has. And it is clear: Whenever the time scale factor of the
NtTimeChartControl changes, the X-coordinate of the objects change.
This means: In order to calculate the X-coordinate of an object's left and right edges you need to know the following:
- The time stamp of the left edge of the sheet:
sheetLeftTicks - The time scaling factor
pixelsPerTick the Time Chart currently uses. - The displacement of left and right edge of your Display Object with respect to its 'hot spot': A cross mark for an event will have the hot spot in its middle and thereby ly centered to the time of the event, while a comment text might located with its left edge on the time stamp of occurrence and then elongate to the right.
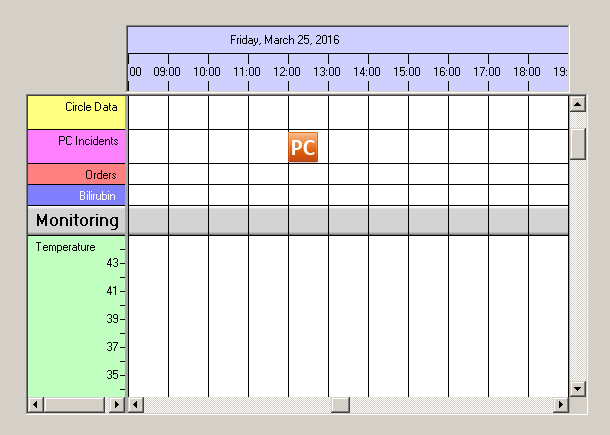
Please see the example below: The event takes place at 12:00. The icon is placed with its left edge to 12:00 while the right edge is more to the right. So the hot spot of the icon lies on its left edge.
But the author could also have designed it in a way that the icons hot spot was in its center so it was located symmetrically to 12:00.
The NtTimeChartControl needs to know about the sheet coordinates of the left and right edges and thereby calls this member function. The implementation
is fairly easy. Here is a code snippet for Display Objects that use icons of 30 pixels width:
For objects that lean out of the sheet it is no error to have negative values for the left edge and values beyond the sheet width for the right edge.
Overload List:
| Modifier / Return Value | Name and Parameters | Description |
|---|---|---|
| NtDisplayObject |
|
Implement this interface method to create a display object for the data object given. |
Return value:
Parameters:
The NtTimeChartControl that does the call. Normally not used if you have only one NtTimeChartControl
in your Form or application. But if you have more than one NtTimeChartControl and implement this interface only onece, this parameter might be helpful.
The data object to do the calculation for.
The time scaling factor the NtTimeChartControl currently works with. It describes the time difference of two neighboring pixels in ticks. One tick
is 100 nano seconds.
The left edge of the NtDisplayObject in ticks. It is the first output parameter of this method.
The right edge of the NtDisplayObject in ticks. It is the second output parameter of this method.
Remarks:
None.