
NtDisplayDef.hotspotX Member
The 'hot spot' of a visual representation of a data object like an icon is normally its top left edge. This means, that the visual representation (e.g. the icons) are aligned with their top edge to a
certain Y-Coordinate (typically 2 pixels from top of the row) and with their left edge to the time stamp of the data object. Changing hotspotY moves the hot spot downwards within the object,
which results in shifting the object's representation (e.g. icon) upwards. For icons that look like a crossmark e.g. it might be reasonable to move the hot spot to the middle.
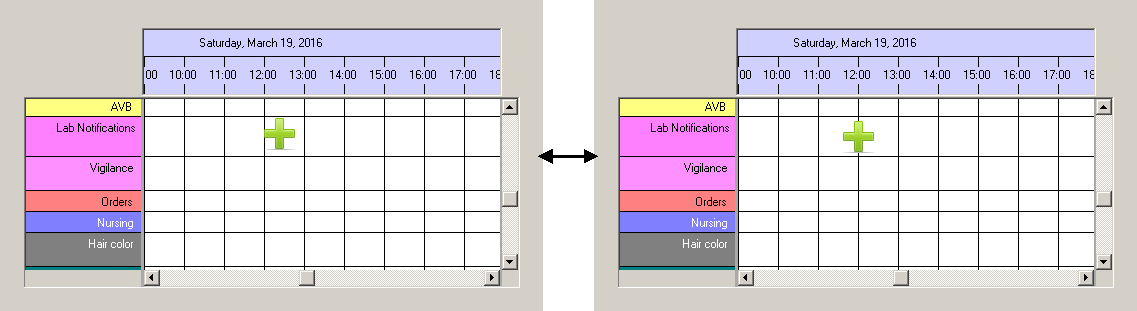
Please see the example figure below: Both images show the same data object. Its time stamp is exactly 12:00. On the left image the hot spot is the top left edge of the icon, which means that its top is
2 pixels below the row top and the left edge is located at the time stamp 12:00. On the right image
Type:
Remarks:
Values can be positive and negative.
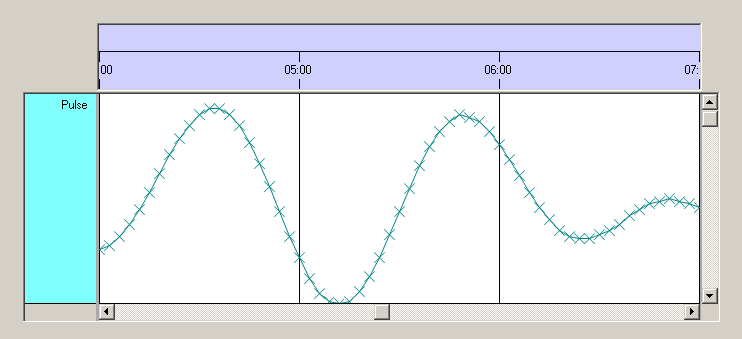
Important: When you choose to display your data in the style of a curve with the displayMode 2 (crossmarked curves), then
See also: