
The Time Scale: Ticks and Pixels
Overview
The horizontal axis of the NtTimeChartControl (and of the NtHeaderControl) is the time axis. Every X-Coordinate of the sheet and of the visible area correlates with a certain time stamp.
The Nateo classes inernally work with the
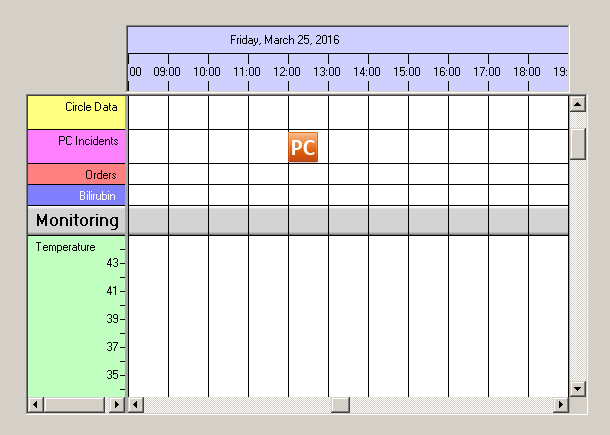
You can see that the Time Chart is separated into columns, each one hour. If you enlarge the image, you will find that each column is 40 pixels wide. So it can be summarized:
- One column is one hour, and one column is 40 pixel.
- So one pixel is 1.5 minutes which is 90 seconds.
- So one pixel is 90 * 10,000,000 ticks, so we have 900,000,000 ticks per pixel.
- So one tick is 1/900,000,000 pixels wide, so we have 1.1111E-9 pixels per tick.
Now take a look onto the icon object (labeled 'PC') that is shown at 12:00 in the screen shot above. The icon is 30 pixels wide. And as we now know the
But what is the sense of calculating the width of an object in ticks?
The NtTimeChartControl internally works with ticks up until the moment when it finally comes to drawing. So when you adjust the time scale of the control to a certain value (like these one hour columns
with 40 pixels each) then the control automatically recaluclates the position of the left and the right edge of all objects in the unit of ticks. Doing so enables the control to quickly decide if an
object intersects with a certain time range or not.
In the example screen shot above suppose you want to know if the 'PC'-object you can see, overlaps the time range from 2:00 pm to 3:00 pm. And it does so if the left edge (given in ticks) is less than 3:00 pm
(in ticks) and the right edge (given in ticks) is greater than 2:00 pm (in ticks). In our example the left edge very well is less than 3:00 pm, but the right edge is not greater than 2:00 pm,
so it does not overlap.
Important: It has to be clearly understood that the left edge of an object is not necessarily the time stamp of that object and that the right edge of that object is not necessarily the end time
stamp: Suppose you have an object that takes place exactly at 12:00 with no duration (also end is 12:00). This object may be represented by a circle of 20 pixels radius that is drawn
around 12:00. Then the left edge of the object could be 11:30 and the right one 12:30 (if we take the ticks per pixel as in the example above).
Summary:
So what we learned in this section is that the NtTimeChartControl can determine the overlapping of an object with a time range with only two comparisons, which is quite fast. In the next section below you will
find out why this is important.
The Sheet: Determine objects to draw.
Back on the page The Data Sheet it was explained that the sheet has a certain extension in time: It ranges from
This directly leads to the conclusion that only those objects are to be drawn that actually overlap the time range of the sheet from
<< Prev.: The Data Sheet Next: Data Objects >>