
The Data Sheet
Overview
The central control of the Time Chart is set up by the class
The so called 'sheet' of the Time Chart is the backplane of this control. Onto this backplane the grid of rows and columns and the data objects themselves are drawn. This plane is not just the client area of the
control that you can see at once. Instead it is bigger: It is the full scrollable area of the control.
In the vertical direction this always covers all rows. So in vertical direction the sheet is always as large as all the rows together. Whenever the row heights change, the vertical scroll range changes
accordingly.
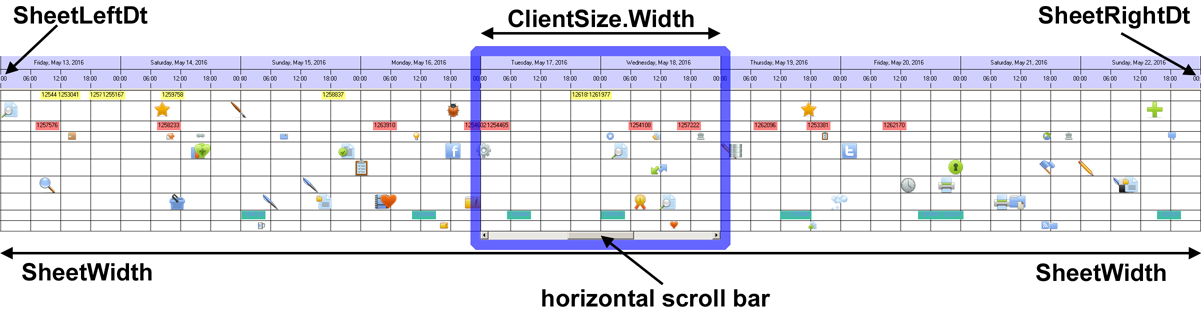
And also in the horizontal direction the sheet is bigger than what you see on the screen. But this sheet does not cover the full time range from year 0 to 9999. Instead it covers a time range that typically is
a few times bigger than the visible client area width of the control (typically ten to twenty times). As a result, the scroll range enables comfortable and precise scrolling.
Although the sheet and (thereby the horizontal scroll range) is limited, users want to be able to scroll along the time axis over days, months and years without being limited. This section describes how this
is achieved. This section first describes the sheet and then how it covers the almost endles time range of 10000 years despite its limited size.
The Sheet
The sheet is the scrollable area of the Time Chart. Scrolling from top to bottom across all rows covers the sheet height. Scrolling once from left to right covers the sheet width.
It becomes obvious that the current sheet covers a certain time range. The
To summarize the capabilities of the NtTimeChartControl:
- The over all time range reaches from year 0000 to year 9999 including. You can place data items anywhere in this range.
- The sheet is only one short section covering some hours, days, or months. You can see the full sheet scrolling from left to right. The sheet is relocated whenever necessary.
- The ClientRect is the visible part of the sheet. By scrolling right and left (or dragging the sheet with the mouse) you move the sheet left and right to move it inside the client area of the control.
- The scroll range of the vertical scroll bar always fits the range necessary to bring all rows into the visible area, but not more.
Endless horizontal Scrolling
Moving the horizontal scroll bar to the leftmost position will move the visible area back in time, while moving it to the rightmost position will move it into the
future. How far depends on the settings the program applied to the control when initializing it. It might range from a few hours to several years.
But what if the scroll bar is being moved to the leftmost position and we are a few days back in the past? How to go on scrolling even further backwards? Here is the trick: When moving the scroll bar to
the far left or right it will not stay put in that position. Instead the display is being adjusted to this new position in time but the scroll button flips back to the middle. You can
pick it from there and move it to the left (or right) again and so on. In this way, you can move to the left or right almost endlessly by repetitivly moving the scroll button while that keeps flipping back to
the center.
It is recommended to run one of the demo applications to see this behaviour, it will become obvious right away.
<< Prev.: Basic Concepts Next: Ticks and Pixels >>