On this page you will find some screenshots showing various use cases of the Nateo Time Chart Control.
|
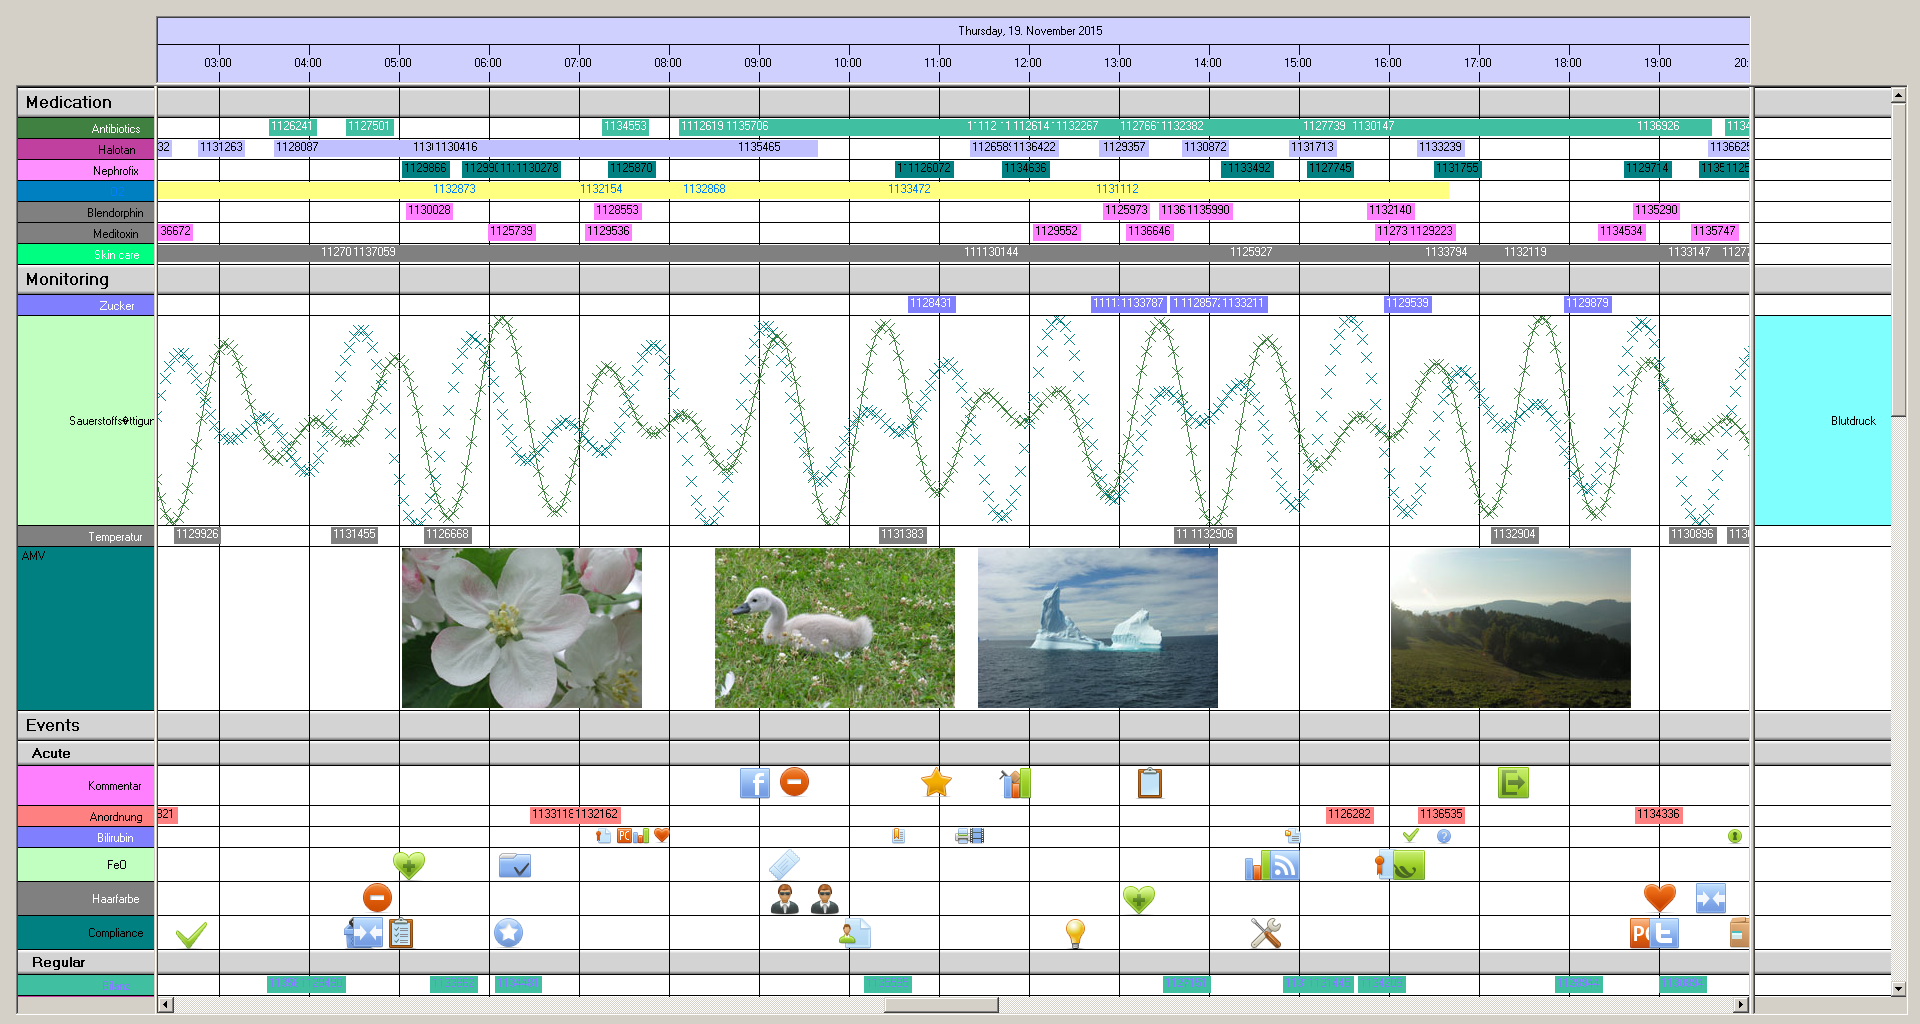
A Nateo Time Chart Control with two Flank Controls (left and right), a Header Control (on top) and scroll bars.
The rows are grouped into categories.
|
|
|
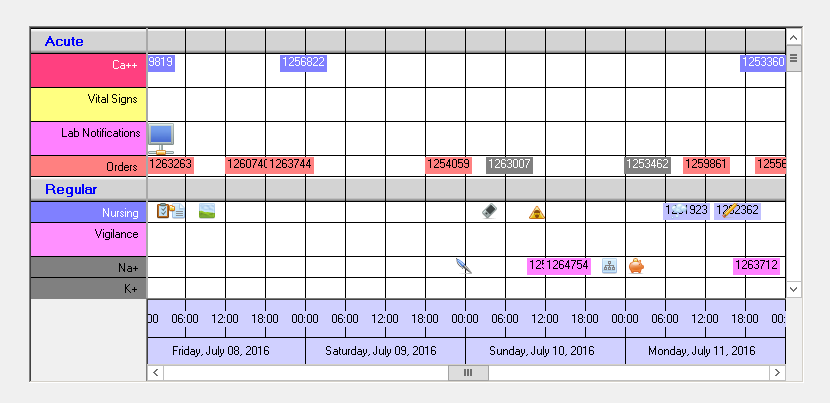
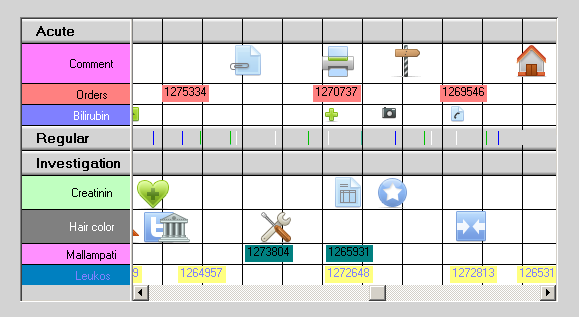
An example with categories 'Acute' and 'Regular', the time scale is located at the bottom (having the group texts below the column names).
|
|
|
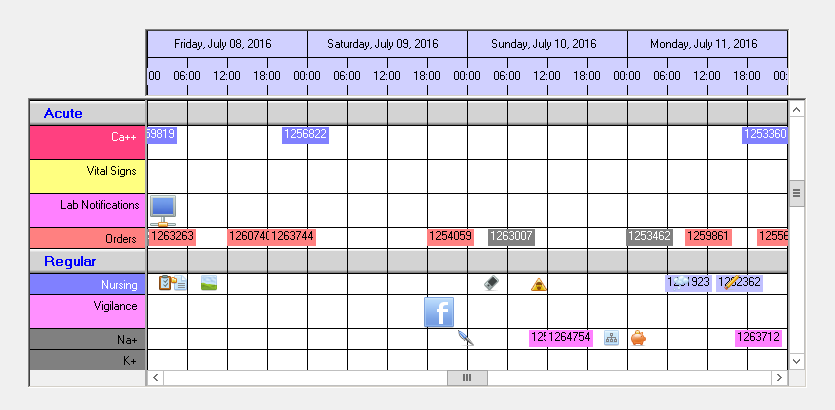
The same example with the Header Control on top (having the groupt texts on top of the column names).
|
|
|
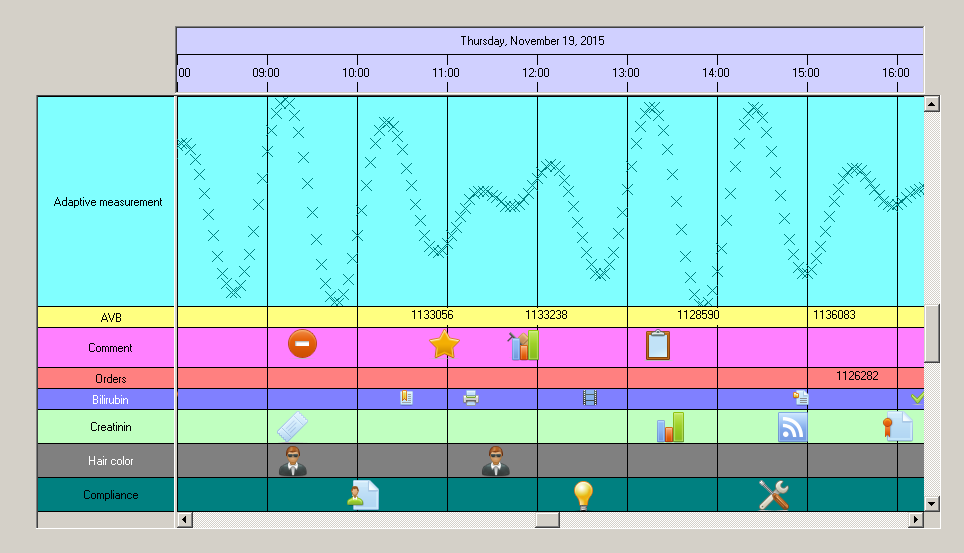
Colored row back grounds.
|
|
|
In this example the category 'Regular' is closed. The data of its hidden rows is indicated by thin lines.
|
|
|
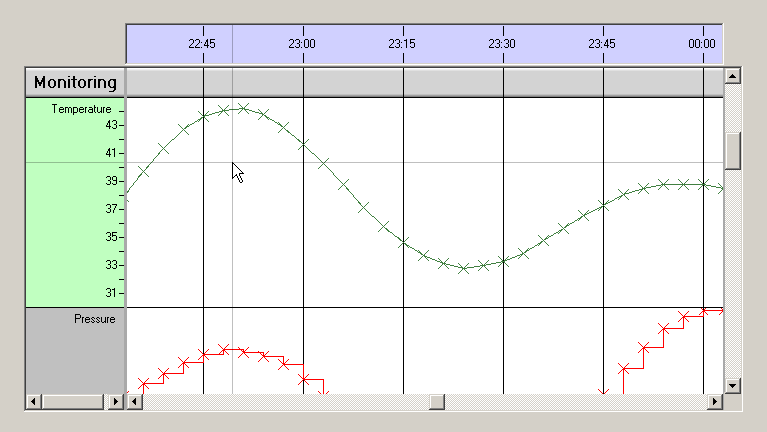
The crosshair function is activated for the row 'Temperature'.
|
|
|
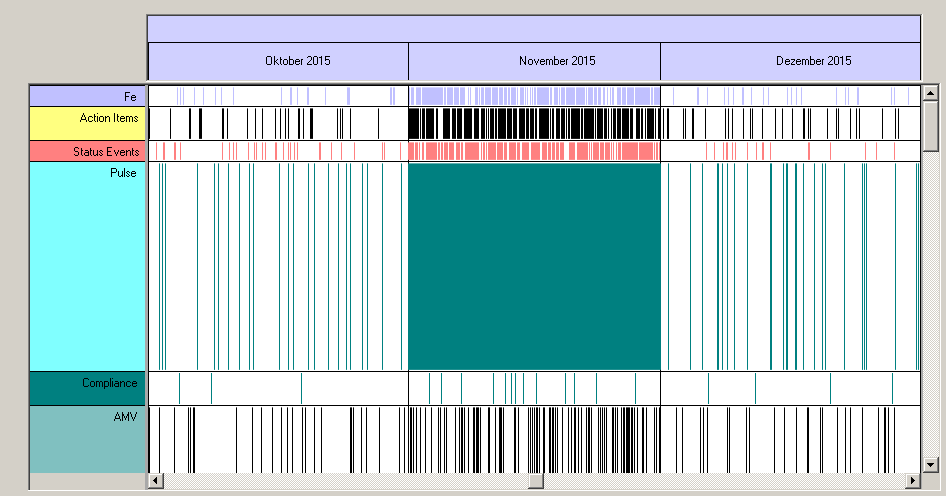
This Time Chart shows a 'Condensed View': You can see that there is a lot of data in November.
|
|
|
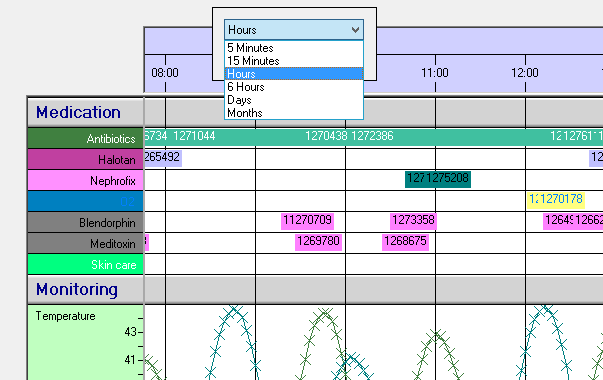
A built in popup allows you to select the time display modes. You can also invoke a calendar to jump to certain dates quickly.
|
