Nateo Tutorial: Data Display
In this tutorial you will set up the Time Chart for displaying data. Then you will create a few data objects and add them to the Time Chart for display.
Gloals:
- Learn to implement the interface NtApplication in order to provide needed information to the Time Chart.
- Set up the NtDisplayDefs to define how different data elements will be displayed.
- Learn to set up the NtRowHeaders as legends for your data. Add them to the Flank Control.
- Learn to create a NtPerspective to define the row order and the assignment of data types to rows.
- Create the NtDataObjects and add them to the Time Chart.
This tutorial starts at the point you reached doing the tutorial Empty Time Chart: You should have a Form with a Time Chart, a Header Control, a Flank Control and the
scroll bars at hand.
1. Thinking of the data to add
First it should be clear which kind of data shall be displayed in the Time Chart. Here we think of only three data types as a small example:
- Data type 'Remarks': To be displayed as text
- Data type 'Photos': To be displayed as an image from a file
- Data type 'Temperature': To be displayed as courve, values ranging from 0 to 100.
2. Implementing the NtApplication Interface
You decide how your data is to be displayed. If you want a certain object to be shown as text, you need to tell the Time Chart, what text to display for your data object. If you decide to represent your
data object as an image, you need to provide the image. This means that the translation of data objects into displayable texts, double values or images has to be done by your own code. In most cases this is
very simple: If your data objects already are texts, numbers, or bitmaps, you simply return your objects and you are done.
The interface NtApplication will be called by the NtTimeChartControl whenever it needs such a data conversation. In this example the data objects within the Time Chart
are already the ones needed for display: A text, a bitmap and some double values for the curve. So no conversion is needed, and you will find the interface methods to simply return the data items. But if the
data objects stored in the Time Chart were more complex (structs or classes) than the interface methods would have to convert them into texts, double values or bitmaps.
So first let your Form inherit from NtApplication by adding that to your Form's headline:
public partial class Form1 : Form, NtApplication
Now we need to declare to the Time Chart, that we implemented this interface. Please add the following line of code to the top of your Form1_Load() member function (it is good
practice to always do this as the first line in your Load() method):
ntTimeChartControl.SetNtApplication(this);
Then implement that interface by adding the member functions to the Form class:
//Interface NtApplication
public bool NtIsHoliday(DateTime dt) { return false; }
public bool NtIsWeekend(DateTime dt) { return false; }
public string NtGetTooltipText(NtDisplayObject tooltipDisplayObject, int ttType) { return tooltipDisplayObject.DataObject.dataItem.ToString(); }
public string NtGetText(NtDataObject ntDo) { return (string)ntDo.dataItem; }
public double NtGetDouble(NtDataObject ntDo) { return (double)ntDo.dataItem; }
public Bitmap NtGetIcon(NtDataObject ntDo) { return null; }
public Bitmap NtGetBitmap(NtDataObject ntDo) { return (Bitmap)ntDo.dataItem; }
You might have noticed that we simply cast the object ntDo.dataItem to a string, double or Bitmap. We do no checks if this cast matches or not. The reason for omitting this check is that
the NtTimeChartControl will call NtGetText() only for those data imtems that shall be drawn as text, and NtGetDouble() only for those to
be drawn as curves and NtGetBitmap() only for those we declared to be drawn as bitmaps etc. And as we stored only strings for our text data type (dataTypeId 100) and only doubles for our
curve data type (dataTypeId 120) etc., this always works properly.
3. Setting up the NtDisplayDefs
Once it is decided what data types you want to display, for each of them you need to create the display definition objects (NtDisplayDefs) to let the Time Chart know how to display the various data types.
In this tutorial we create all three NtDisplayDefs manually. In a professional application you would read them from a configuration data set in a data base or from a configuration file, as you might need
a lot of them to define display for many different data types.
For now, simply add the following block of code to the end of your Form1_Load() member function:
//Create the NtDisplay Defs
NtDisplayDef ntDisplayDef = new NtDisplayDef();
ntDisplayDef.dataTypeId = 100; //randomly choosen between 1 and 10000
ntDisplayDef.displayMethod = 1; //Text
ntDisplayDef.preferredRowHeight = 25;
ntDisplayDef.textBrush = Brushes.Black;
ntDisplayDef.foregroundBrush = Brushes.LightCoral;
ntTimeChartControl.SetDisplayDef(ntDisplayDef);
ntDisplayDef = new NtDisplayDef();
ntDisplayDef.dataTypeId = 110; //randomly choosen another one between 1 and 10000
ntDisplayDef.displayMethod = 3; //Bitmap
ntDisplayDef.preferredRowHeight = 160;
ntTimeChartControl.SetDisplayDef(ntDisplayDef);
ntDisplayDef = new NtDisplayDef();
ntDisplayDef.dataTypeId = 120; //randomly choosen a third one between 1 and 10000
ntDisplayDef.displayMethod = 2; //Curve with cross marks
ntDisplayDef.preferredRowHeight = 220;
ntDisplayDef.hotspotX = ntDisplayDef.hotspotY = 5; //defining the cross size of 10 pixels with the hot spot in the center (5).
ntDisplayDef.foregroundPen = Pens.Blue;
ntDisplayDef.lineMaxSeconds = 3600; //one hour maximum distance between two connected samples.
ntDisplayDef.lineType = 1; //direct line between two connected samples
ntDisplayDef.crosshairType = 3; //horizontal and vertical cross hair
ntTimeChartControl.SetDisplayDef(ntDisplayDef);
4. Creating the Row Headers
The Row Headers will act as the legend for the data we show. For simplicity reasons we stick to simple text and colors. Please add the following code to the end of your
Form1_Load() member function:
Graphics g = CreateGraphics();
NtRowHeader rh = new NtRowHeader();
rh.InitRowHeaderText("Remarks", Font, Brushes.Black, Brushes.LightCoral, g);
ntTimeChartControl.SetRowHeader(100, rh);
rh = new NtRowHeader();
rh.InitRowHeaderText("Photos", Font, Brushes.White, Brushes.Blue, g);
ntTimeChartControl.SetRowHeader(110, rh);
rh = new NtRowHeader();
rh.InitRowHeaderText("Temperature", Font, Brushes.Black, Brushes.LightSalmon, g);
ntTimeChartControl.SetRowHeader(120, rh);
g.Dispose();
The Graphics object is needed by the NtRowHeader to calculate the pixel size of the row titles we define as parameters.
5. Setting the Perspective
Until now we defined how to display the data and how the legend looks. But no one yet defined the order of the rows yet. This is done by a so called NtPerspective that we will
define in this step. This Perspective contains one NtRowPerspective per row you want to have in your Time Chart. Please add the following code to the end of your
Form1_Load() member function:
//Creating the Perspective and its Row Perspectives:
NtPerspective ntPerspective = new NtPerspective();
NtRowPerspective rowPerspective = new NtRowPerspective();
rowPerspective.rowHeight = 25;
rowPerspective.dataTypeIds.Add(100);
ntPerspective.rowPerspecives.Add(rowPerspective);
rowPerspective = new NtRowPerspective();
rowPerspective.rowHeight = 160;
rowPerspective.dataTypeIds.Add(110);
ntPerspective.rowPerspecives.Add(rowPerspective);
rowPerspective = new NtRowPerspective();
rowPerspective.rowHeight = 120;
rowPerspective.dataTypeIds.Add(120);
ntPerspective.rowPerspecives.Add(rowPerspective);
ntTimeChartControl.SetNtPerspective(ntPerspective);
As you can see we only add one data type id to each of the Row Perspectives because we want each data type to be show in a row on its own. As an alternative you could also add more than one data type id to
one Row Perspective. In this case you would finally find two different data types within one row.
6. Creating the data and putting it into the Time Chart
Finally we will now enter data into the Time Chart. We will add a plot of 180 'Temperature' values, one 'Remark' and one 'Photo'. Please add the following code to the end of
your Form1_Load() member function:
//Adding Data to the Time Chart
List<NtDataObject> dataObjects = new List<NtDataObject>();
ulong objId = 1;
DateTime now = DateTime.Now.ToUniversalTime(); //Internally the NtTimeChartControl works with Universal Time
NtDataObject dataObject = new NtDataObject();
dataObject.objId = objId++;
dataObject.dataTypeId = 100;
dataObject.dataItem = "Hello World!";
dataObject.dt = dataObject.dtEnd = now;
dataObjects.Add(dataObject);
dataObject = new NtDataObject();
dataObject.objId = objId++;
dataObject.dataTypeId = 110;
try { dataObject.dataItem = new Bitmap("image1.jpg"); }
catch (Exception) { MessageBox.Show("Image image1.jpg not found!"); }
dataObject.dt = dataObject.dtEnd = now;
dataObjects.Add(dataObject);
for (int i = 0; i < 180; ++i)
{
dataObject = new NtDataObject();
dataObject.objId = objId++;
dataObject.dataTypeId = 120;
dataObject.dataItem = (double)(50.0 * Math.Sin(i / 45.0 * Math.PI) + 50.0);
dataObject.dt = dataObject.dtEnd = now.AddMinutes(5 * (i - 90));
dataObjects.Add(dataObject);
}
ntTimeChartControl.SetData(dataObjects);
7. Testing the Application
At this point things should look like this:
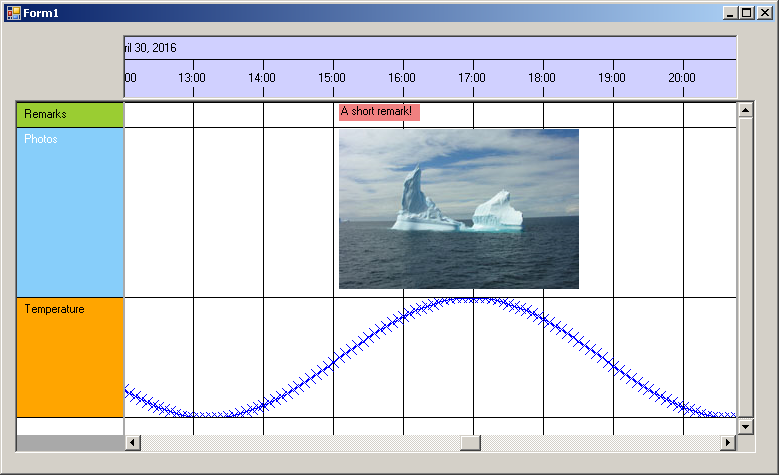
You can now try some features of the Time Chart: Tooltips on the data objects, scrolling, changing the row order (by pressing Ctrl and drag the Row Headers vertically), change the time scale zoom (by
pressing Ctrl and use the mouse wheel while the Time Chart is focussed), drag objects horizontally (by pressing Ctrl and dragging objects with the mouse), etc.
Summing up...
The first step in this tutorial was setting up the NtApplication interface. Then you prepared the display and added data. The important thing here was that there is one linking item
accross all these steps: The data type ID. We created 100, 110, and 120. For each of them you create a NtDisplayDef and to each data type you assign one NtRowHeader.
And each data type is assigned to a row by the NtRowPerspectives within the NtPerspective. And finally you create data objects, each being of one data type that
you speicfy by setting the NtDataObject's dataTypeId.
So the setup and definitions are made per data type and for each data type you then add as many data objects as you like.
Back to Overview
