
Nateo Tutorial: Huge Data Sets
In the recent tutorials we created our small amounts of demo data during runtime. And also the display definitions like colors, display modes and row assignments were hard coded.
In a professional application you will load the data from files or from a data base. And the definition of the display will also be stored in kind of a configuration file or database so it can be modified by
administrators rather than programmers.
In this tutorial we will now load a huge amount of data from a file into a Time Chart that has been set up from configuration files. Once the Time Chart and aligning controls are created, the startup is done
in three phases:
- Create the Display Definitions (stored in
NtDisplayDef objects) and the Row Headers (stored inNtRowHeaders ). - Define the row set and categories by setting up a
NtPerspective . - Load the data from the data source into
NtDataObjects and put them into theNtTimeChartControl .
1. Create a Windows Form Application and add the Controls
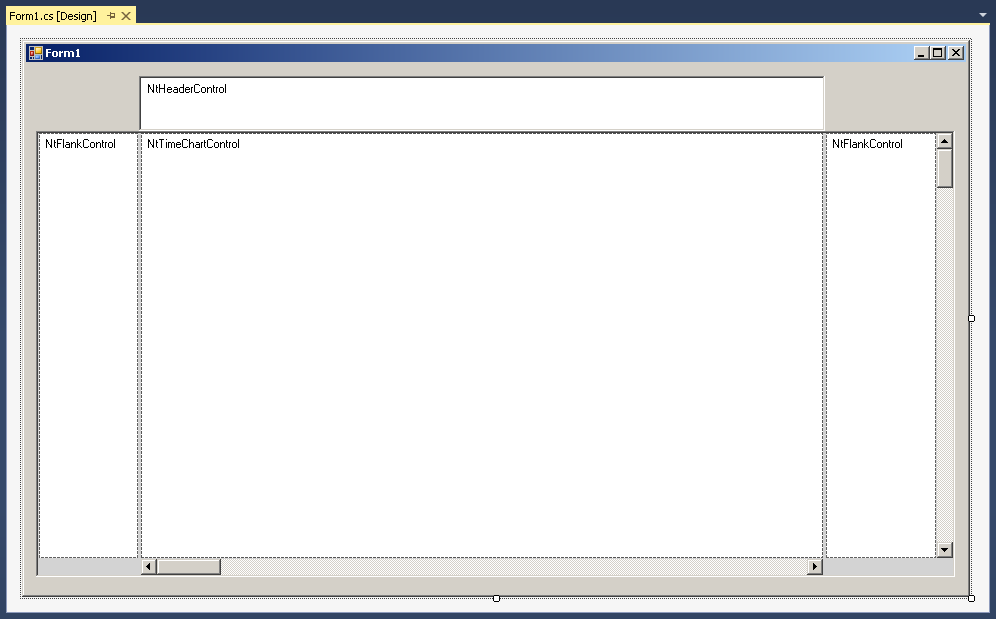
For this tutorial we need a Time Chart with two Flank Controls as shown in the tutorial Row Headers and Flank Controls. So please create a Form like done
there (but without the horizontal scroll bars for the Flank Controls). It will look like this:
2. Add a NtApplication interface implementation as a seperate class to your solution
Next step is to implement the
3. Add member fields to the Form class
To your form please add the following private members:
4. Initialize the Time Chart in your Load() method
Please let the
5. Add a class for reading the data and configuration files
The code of this tutorial can be found in the 'Tutorials' folder of this tutorial package. There you will find the file 'TutorialData.cs' that contains the class for reading the demo data files provided for this
tutorial. The class simply reads those files and creates Lists of NtDisplayDefs or Lists of NtDataObjects from tabular files and can also read NtPerspective Objects from tabular files. Please simply include this class
to your project and take a look into the code. It is pretty straight forward.
6. Load Display Definitions, Perspective and Data from files
We will now call the member functions of the
- Load the
NtDisplayDefs from a tabular file. - Load the
NtPerspective from a tabular file. - Load the
NtDataObject s from a tabular file.
So at the end of your
7. Set up the Time Chart and add the Data
In this final step we will apply the configuration data we loaded to the
Testing
Starting the application you should see the following:
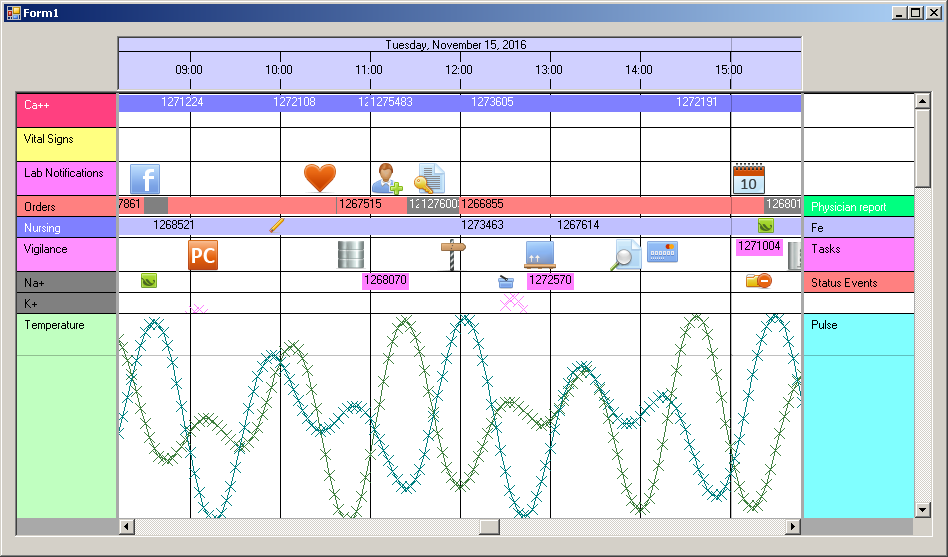
Again please note that the tutorial data has some time areas with lots of data (always in November in the years 2007 to 2017), so we jump to November 2016 after launch.
So these are the conclusions from this tutorial:
- Configuration of how certain data types shall look like, and what the names and settings of the Row Headers are, should not be hard coded. They should be taken from configuration data bases or files.
- A common mechanism for loading data makes sense for all kind of data, no matter how it will then be displayed. Storage always takes place in
NtDataObject instances or subclasses. - The
NtDisplayDefs define how a certain data type looks like. TheNtPerspective defines the assignment of data types to rows. For example you will find a few rows that have two data types assigned and thereby have a Row Header placed in the right Flank Control.
Outlook
When taking a look into the 'displayDefs.txt' file (directory 'data') you will find a simple table with several columns:
DataTypeId, DisplayMode, RowHeight, IconWidth, BackgroundColor, ForegroundColor, TextColor, LineMaxSeconds, LineType, RowHeaderString
This information does not cover all fields of a
Back to Overview