Nateo Tutorial: Row Headers and Flank Controls
A Row Header is the legend for a single row within the Time Chart. Row Headers are located in the Flank Controls. A row can have no Row Header at all and a Time Chart can exist without any Flank Control
(and thereby can not have any Row Headers at all). A Time Chart can have more than one Flank Control. For example it can have one to the left side and one to the right. In this case a row can have
two Row Headers (one in each of the Flank Controls). The assignment of Row Headers to rows is done by the so called NtPerspective which is covered in the
NtPerspective Concept.
In this tutorial we will elaborate on how to create NtFlankControls and NtRowHeaders. Therefore we will create a Form with a NtTimeChartControl
and two NtFlankControls (one to the right and one to the left).
Gloals:
- Learn to add multiple Flank Controls to your Form and link them to the NtTimeChartControl and the NtBackPanel
- Learn to assign the NtRowHeaders (which are the legends for the data) to the Flank Controls and the appropriate row
1. Create the application and add the controls
The first step is to create a Windows Forms application as you did in the first tutorial Empty Time Chart with the following changes:
a) Instead of one NtFlankControl, please add two of them: One to the left of the NtTimeChartControl and one to the right.
b) Name the left NtFlankControl ntLeftFlankControl and the right one ntRightFlankControl.
c) To the bottom of each of the Flank Controls please add one NtHScrollBar. Name them ntLeftFlankControlHScroll and ntRightFlankControlHScroll.
In the designer things should look like this:
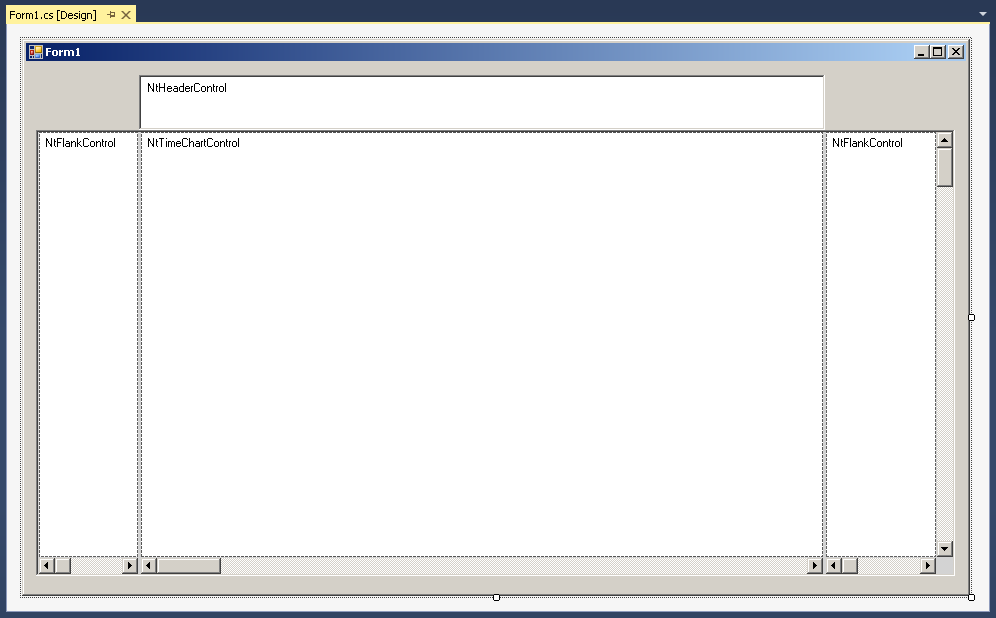
A few hints about the properties of the controls:
- Set the BorderStyle of the NtBackPanel and the NtHeaderControl to Fixed3D.
- Send the NtBackPanel to the back of the z-Order (either by clicking the appropriate symbol in the IDE or by adding it to the Form's Controls list as the last member).
- Set the background color of the NtTimeChart to white.
- Set the Anchor of the ntLeftFlankControl to (Top, Bottom, Left).
- Set the Anchor of the ntRightFlankControl to (Top, Bottom, Right).
- Set the Anchor of the ntLeftFlankControlHScroll to (Bottom, Left).
- Set the Anchor of the ntRightFlankControlHScroll to (Bottom, Right).
You should have a Form1_Load() method in your Form and the initialization of the controls in it should look like this:
ntTimeChartControl.Init(10 * 24, 90, TimeDisplayMode.hours);
ntTimeChartControl.SetScrollBars(ntTimeChartControlHScrollBar, ntTimeChartControlVScrollBar);
ntHeaderControl.Init(ntTimeChartControl, Font, Font, false);
ntLeftFlankControl.Init(ntTimeChartControl, ntLeftFlankControlHScroll, 120); //120 pixels is the width of the NtFlankControl's sheet.
ntRightFlankControl.Init(ntTimeChartControl, ntRightFlankControlHScroll, 120); //120 pixels is the width of the NtFlankControl's sheet.
ntBackPanel.SetPadding(2, 2, 2, 2);
ntBackPanel.Repos(ntLeftFlankControl, ntLeftFlankControlHScroll, ntRightFlankControl, ntRightFlankControlHScroll, ntTimeChartControl, ntTimeChartControlHScrollBar, ntTimeChartControlVScrollBar);
ntTimeChartControl.ScrollToDt(DateTime.Now, ntTimeChartControl.ClientSize.Width / 2, 0);
ntTimeChartControl.Focus();
2. Create Display Definitions for three different data types
In this example we want to see three different data types in our Time Chart: Remarks (displayed as text), Temperature (displayeds as curves), and Pressure (also curve). So we create three differen
NtDisplayDef objects. Please add the following code to the end of your Form1_Load() method:
NtDisplayDef ntDisplayDef = new NtDisplayDef();
ntDisplayDef.dataTypeId = 100; //randomly choosen between 1 and 10000
ntDisplayDef.displayMethod = 1; //Text
ntDisplayDef.preferredRowHeight = 25;
ntDisplayDef.textBrush = Brushes.Black;
ntDisplayDef.foregroundBrush = Brushes.LightGreen;
ntTimeChartControl.SetDisplayDef(ntDisplayDef);
ntDisplayDef = new NtDisplayDef();
ntDisplayDef.dataTypeId = 110; //randomly choosen a third one between 1 and 10000
ntDisplayDef.displayMethod = 2; //Curve with cross marks
ntDisplayDef.preferredRowHeight = 120;
ntDisplayDef.hotspotX = ntDisplayDef.hotspotY = 5; //defining the cross size of 10 pixels with the hot spot in the center (5).
ntDisplayDef.foregroundPen = Pens.Red;
ntDisplayDef.lineMaxSeconds = 3600; //one hour maximum distance between two connected samples.
ntDisplayDef.lineType = 1; //direct line between two connected samples
ntDisplayDef.scaleMin = 0;
ntDisplayDef.scaleMax = 100;
ntTimeChartControl.SetDisplayDef(ntDisplayDef);
ntDisplayDef = new NtDisplayDef();
ntDisplayDef.dataTypeId = 120; //randomly choosen a third one between 1 and 10000
ntDisplayDef.displayMethod = 2; //Curve with cross marks
ntDisplayDef.preferredRowHeight = 120;
ntDisplayDef.hotspotX = ntDisplayDef.hotspotY = 5; //defining the cross size of 10 pixels with the hot spot in the center (5).
ntDisplayDef.foregroundPen = Pens.Blue;
ntDisplayDef.lineMaxSeconds = 3600; //one hour maximum distance between two connected samples.
ntDisplayDef.lineType = 1; //direct line between two connected samples
ntDisplayDef.crosshairType = 3; //horizontal and vertical cross hair
ntDisplayDef.scaleMin = 10;
ntDisplayDef.scaleMax = 20;
ntTimeChartControl.SetDisplayDef(ntDisplayDef);
Please note that we defined different values for scaleMin and scaleMax in the second and thirdNtDisplayDef.
3. Create the Row Headers
Here starts the important part of this tutorial: We will now create the Row Headers. For Temperature and Pressure we want to have Row Headers that show a scale. For this reason we create a subclass of
NtRowHeader that creates a bitmap with a scale in it. The constructor takes the scale limits. So please add a new code file named 'ScaleRowHeader.cs' to your project and add:
using System.Drawing;
using Nateo;
namespace T04
{
public class ScaleRowHeader : NtRowHeader
{
public double scaleMin, scaleMax, scaleStep;
public bool rightSide = false;
public ScaleRowHeader(double _scaleMin, double _scaleMax, double _scaleStep, bool _rightSide)
{
scaleMin = _scaleMin;
scaleMax = _scaleMax;
scaleStep = _scaleStep;
rightSide = _rightSide;
}
public void InitScaleBitmap(int width, int height, Font _font, Color color, Brush _bkBrush)
{
bitmap = new Bitmap(width, height);
Graphics g = Graphics.FromImage(bitmap);
g.FillRectangle(_bkBrush, 0, 0, width, height);
double dy = height / (scaleMax - scaleMin);
int count = 0;
textBrush = new SolidBrush(color);
Pen pen = new Pen(color);
for (double i = scaleMin; i < scaleMax; i += scaleStep, ++count)
{
double y = height - (i - scaleMin) * dy;
g.DrawLine(pen, rightSide ? 0 : width - 10, (float)y, rightSide ? 10 : width, (float)y);
SizeF size = g.MeasureString("" + i, _font);
if (count % 2 == 1) g.DrawString("" + i, _font, textBrush, rightSide ? 10 : width - size.Width - 10, (float)(y - size.Height / 2.0));
}
g.Dispose();
InitRowHeaderBitmap(bitmap, _bkBrush);
}
}
}
Then to the end of your Form's Form1_Load() method please add the code that creates one Row Header for the text and one Scale Row Header for the curves:
//Create the Row Headers
Graphics g = CreateGraphics();
NtRowHeader rh = new NtRowHeader();
rh.InitRowHeaderText("Remarks", Font, Brushes.Black, Brushes.YellowGreen, g);
ntTimeChartControl.SetRowHeader(100, rh);
ScaleRowHeader srh1 = new ScaleRowHeader(0, 100, 20, false); //false: left scale
srh1.InitScaleBitmap(120, 170, Font, Brushes.White, Brushes.Blue);
ntTimeChartControl.SetRowHeader(110, srh1);
ScaleRowHeader srh2 = new ScaleRowHeader(0, 100, 20, true); //true: right scale
srh2.InitScaleBitmap(120, 170, Font, Brushes.White, Brushes.Blue);
ntTimeChartControl.SetRowHeader(120, srh2);
g.Dispose();
4. Setup the Perspective and its Row Perspectives
To set up the row assignment we define the Perspective that defines the rows. Please note that we will add one data type id to the first row (100) and two to the second (110 and 120). On this way we
define that the first row will contain only the Remarks, while the second one contains both the Temperature and Pressure curves.
The trick here is that we add data type id 110 first, so Temperature will be hosted in the first Flank Control (the left one) while 120 is added as second one so Pressure will be hosted in the second
Flank Control (the right one). Please add the following code to the end of your Form's Form1_Load() method:
//Create the Perspective and its Row Perspectives:
NtPerspective ntPerspective = new NtPerspective();
NtRowPerspective rowPerspective = new NtRowPerspective();
rowPerspective.rowHeight = 25;
rowPerspective.dataTypeIds.Add(100);
ntPerspective.rowPerspecives.Add(rowPerspective);
rowPerspective = new NtRowPerspective();
rowPerspective.rowHeight = 170;
rowPerspective.dataTypeIds.Add(110);
rowPerspective.dataTypeIds.Add(120);
ntPerspective.rowPerspecives.Add(rowPerspective);
ntTimeChartControl.SetNtPerspective(ntPerspective);
5. Add Data
Finally we will now add data to the time chart: One 'Hello World!' text, a Temperature curve and a Pressure curve. Please add the following code to the end of your Form's Form1_Load() method:
//Add Data to the Time Chart
List dataObjects = new List();
ulong objId = 1;
DateTime now = DateTime.Now.ToUniversalTime(); //Internally the NtTimeChartControl works with Universal Time
dataObjects.Add(new NtDataObject() { objId = objId++, dataTypeId = 100, dataItem = "Hello World!", dt = now, dtEnd = now });
for (int i = 0; i < 180; ++i)
{
NtDataObject dataObject = new NtDataObject() { objId = objId++, dataTypeId = 110 };
dataObject.dataItem = 50.0 * Math.Sin(i / 11.25 * Math.PI) + 50.0;
dataObject.dt = dataObject.dtEnd = now.AddMinutes(20 * (i - 90));
dataObjects.Add(dataObject);
}
for (int i = 0; i < 180; ++i)
{
NtDataObject dataObject = new NtDataObject() { objId = objId++, dataTypeId = 120 };
dataObject.dataItem = 5.0 * Math.Sin(i / 22.5 * Math.PI - Math.PI/4) + 15.0;
dataObject.dt = dataObject.dtEnd = now.AddMinutes(20 * (i - 90));
dataObjects.Add(dataObject);
}
ntTimeChartControl.SetData(dataObjects);
6. The NtApplication Interface
In this example we do not implement the NtApplication interface because we do not care about special colors for weekends and holidays or about tooltips. But how does the time chart know how
to interpret our double values? The answer is the internal default implementation of the NtApplication interface: It is able to deal with double values and strings. It can convert a string into
a double and vice versa. So depending on how you want to show the data (as string or curve) it can convert the data (if possible).
Discussion
The result should look like this:
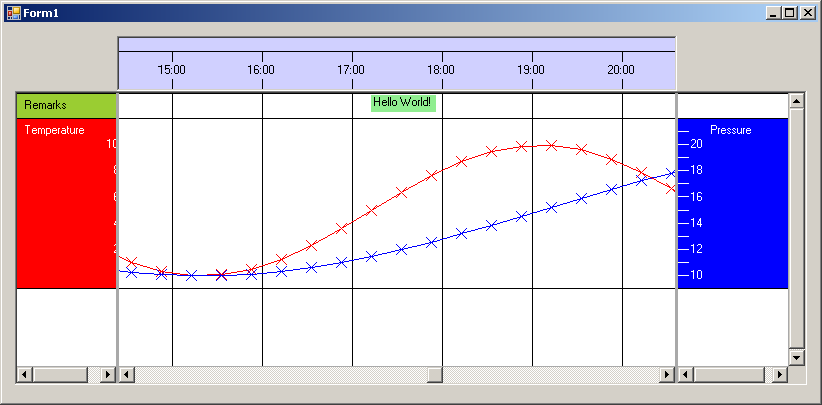
As you can see the left Scale Row Header does not perfectly fit into the Flank Control. The sheet of the Flank Control was defined to be 120 pixels wide. But obviously the Flank Control itself is more narrow.
For this reason the horizontal scroll bar below the Flank Control can be used to scroll the content of the Flank Control horizontally. Of course in this case this is really poor style. It is done for demonstration
purposes here, but nomally you would not to something like this. Still it can be possible that you are forced to display larger information in a Row Header and then you must offer a scrolling option. But
if not you should not even display a horizontal scroll bar for the Flank Controls.
Anyhow this example shows how you can provide a scale for your data and how you can add two legends to one row - one on the left side, one on the right. Running the example will show that even the crosshair and
default tooltips are active which allows a good interpretation of the data.
Finally please note that in the right Flank Control there is no Row Header for the first row. It is perfectly fine not to have a Row Header for every row within a Flank Control.
Back to Overview
