
Nateo Concept: Perspectives
Arranging data in rows
The Time Chart is organized in rows. And as explained in earlier chapters all data of one and the same type is shown in one and the same row. This does not necessarily mean that one row contains only one type
of data. One row can contain more different data types. Suppose you have pressure data and temperature data. Then all temperature values are displayed in one row. It is not possible to show two different
temperature values in two different rows. They will appear in the same row. And the same fits for the pressure values which all show up in a certain row. Anyway it is possible that temperature and pressure are
shown in different rows or they might all be shown in the same row.
So how is it defined which data is arranged in which row? For example how is it defined that temperature shows up in the first row, while pressure is located in the second row?
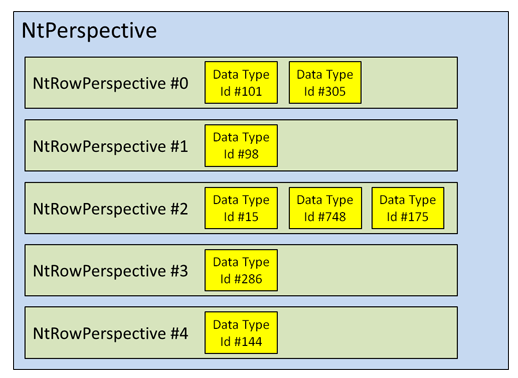
The so called 'Perspective' is the answer to these questions. The Perspective defines which data is shown in which row. Basically the Perspective contains a list of so called 'Row Perspectives'. A
Row Perspective is the data type assignment for a single row. In other words, the Row Perspective again contains a list of all data types that are located in that row.
The class type of the Perspective is
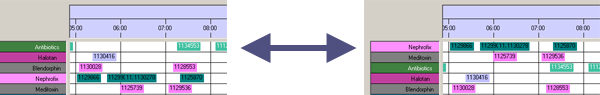
In the following figure you can see the same data shown by two different Perspectives that differ in the order or Row Perspectives, only:
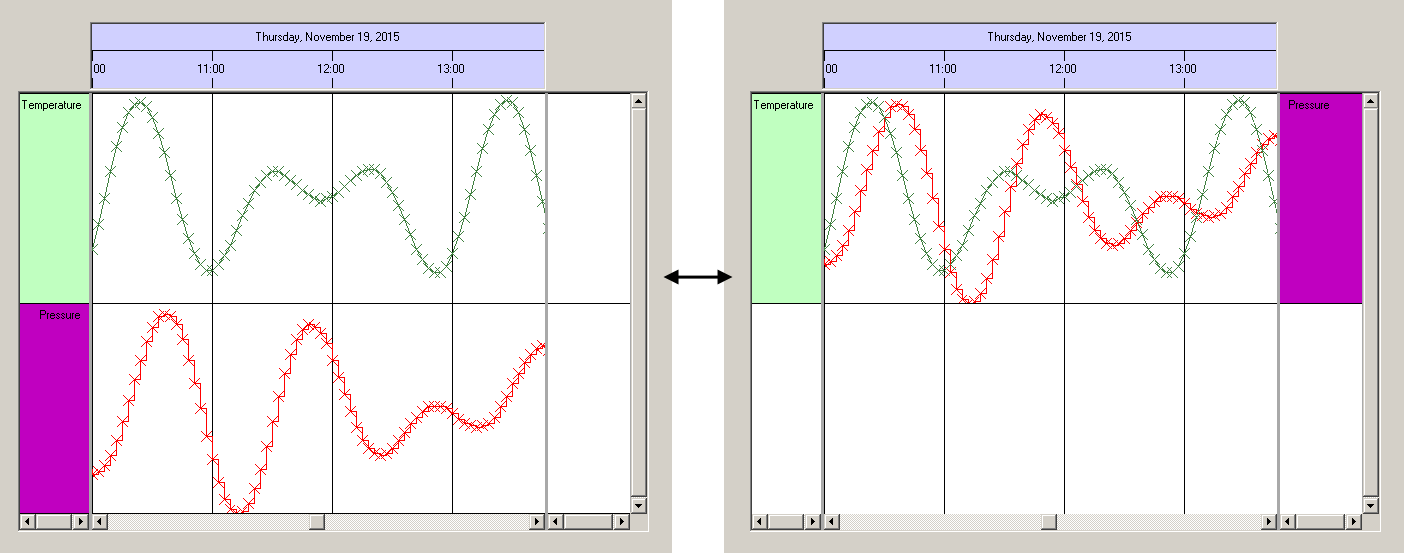
The next example shows how it might look like if two different data types are placed in the same row: In the left image you can see temperature and pressure shown in different rows, while in the right image both types of data are shown in the same row. Please note that the way how temperature and pressure are drawn does not change. The Perspective is only about row assignment.
Row Heights
Obviously the height of the rows can be different among the rows within one Time Chart. This is also defined by the Perspective: Each of the
Defining Categories
Categories are groups of rows with one leading row (the so called Category Row). Typically your application will group rows into categories that contain similar types of data. For example in a medical
application like a patient file you might have a category for lab values one for vital signs, one for medication and so on. For details on categories please see the chapter before:
Concept Categories.
The definition of Categories is also done by the Perspective: Each of the
Example:
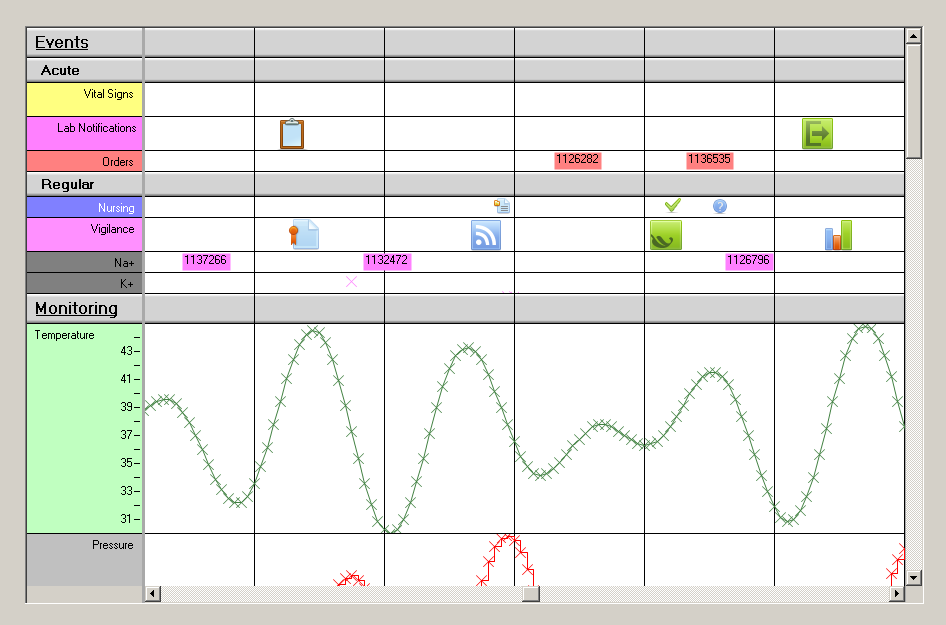
Suppose you want to organize your Time Chart in three layers: Main categories, subcategories and data rows. In the following image you can see an example like this: The main categories are 'Events' and
'Monitoring'. In 'Events' you find two subcategories 'Acute' and 'Regular' along with their data rows, while in 'Monitoring' you do not have subcategories but just data rows.
How does the Perspective look like in this case?
The
The second row is a subcategory row. It does not contain any dataTypeIds but its
The third row is a data row. It contains the dataTypeId of the data type 'Vital Signs'. The
Fourth and fith row are like the third, all having category level 2.
The sixth row has
Row #11 again is a main category level. It has
The following rows are interesting again: They are data rows and thereby again have
So there are some important facts to learn from this example:
- High level categories have lower
categoryLevel values (meaning that top most categories have 0). - All data rows have the same
categoryLevel , which is one greater than thecategoryLevel of the deepest subcategory. - It is not neccessary to have all sublevels in a main category. You can jump over certain levels and have deeper levels or data rows, only.
- If you do not want categories at all but only data rows, then all data rows have
categoryLevel 0.
A few words about the grouping: In the sequence from top to bottom row (first to last member in the Perspectiv's list of Row Perspectives) a superior category (lower
In other words: A row of
So if you close a category of level n, all subsequent rows having a
Applying a Perspective to the Time Chart
Once you created and defined an object of type
When users change the order of rows or the order of categories or open and close categories, they automatically change the Perspective that currently is in use. In some cases you might want to save the
current state of the display in order to reuse it later. Therefore you can call
<< Prev.: Categories Next: Row Headers and Flank Controls >>