
Nateo Concept: Categories
Overview
The
Now imagine that the business has many different events connected to customers (customer calls, orders, etc.), different data connected to team members (vacation, trainings, assignments, etc.), and different data
connected to ressources (room availability, machine occupation, etc.). Then it becomes clear that you might want to organize the huge amount of rows into certain categories:
'Customer Events', 'Team Data', 'Ressource Allocation'. And maybe you even want to define subcategories. In the end the organization of the data can be understand as a tree. The branches are called categories
(and subcategories) while the actual rows make up the leafs.
The
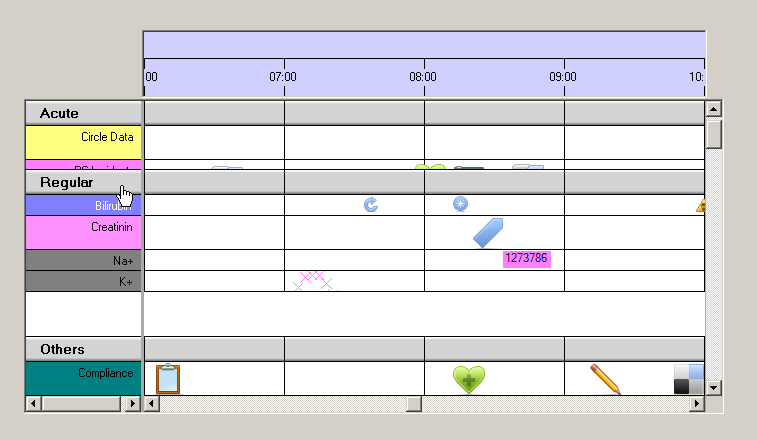
Please see the image below for an example from a medical application with three categories ('Acute', 'Regular', and 'Investigation'). The image shows how the category 'Regular' is being closed:
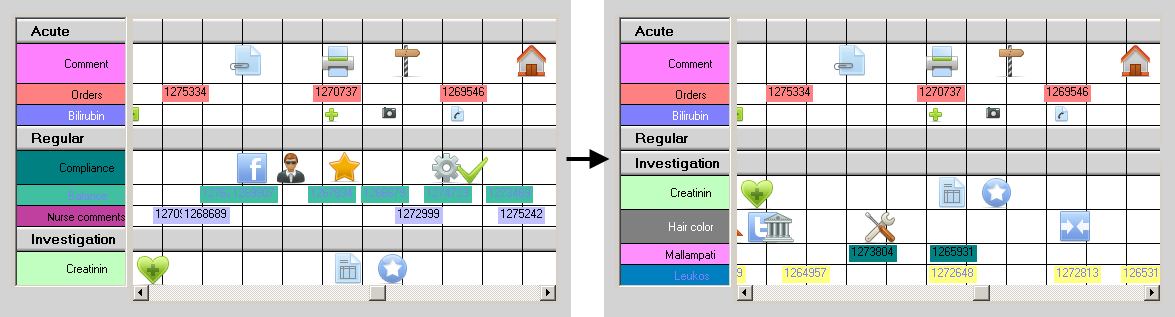
Users can close and open categories by double clicking on the category lines. Doing so will raise an event that can be caught and cancelled to prevent the action. On this way your application can control specifically if users can interact with a category or not.
How to define Categories
The current setup of rows and categories shown by the Time Chart is called 'Perspective' as it is the current perspective on the data. The Perspective defines which data types are located in which rows. And it
defines which categories exist and which of those are currently open or closed. Whenever users open or close categories or change the order of rows, they change the Perspective. The application can retrieve
the current Perspective at any time from the Time Chart or load another one into it to change the view.
Please see the next chapter to get more detail on Perspectives and how they define Categories.
Category Lines
Users close categories in order to hide rows so they get a better overview over the remaining data. The trade off is that you can not see the hidden data and do not even know that there is data.
To reduce this trade off, the
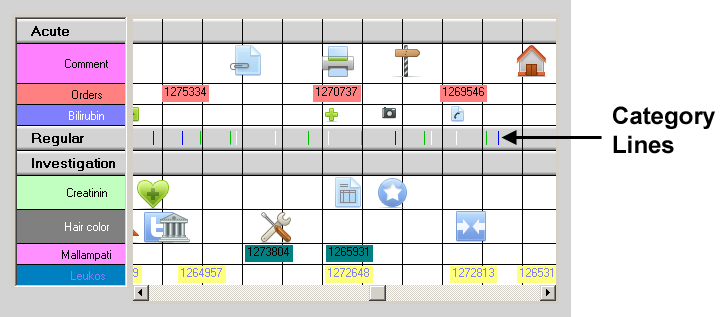
The Category Lines can be switched of in case you do not want to make use of that feature. Simply set the property
ntTimeChartControl.ShowLinesOnCategoryRows to
Subcategories
Categories can have subcategories and those can have sub-subcategories and so on. You can understand the arrangement of data rows as kind of a tree like a folder tree in a directory system:
Folders can contain subfolders and files, while categories can contain subcategories and data rows. As the files make up the leafs of the folder tree, the data rows make up the leafs of the category tree.
Example:
Please take a look onto the following figure:

On the left you can see a folder tree: The root 'NtTimeChart' has two folders 'Events' and 'Medication'. The folder 'Events' has subfolders named 'Acute' and 'Regular'. The Folders 'Acute', 'Regular',
and 'Medication' contain files (with data), which make up the leafs of the tree.
On the roght you can see a Time Chart (as a root): It has two categories 'Events' and 'Medication'. The category 'Events' has subcategories named 'Acute' and 'Regular'. The categories 'Acute', 'Regular',
and 'Medication' contain rows (with data), which make up the leafs of the tree.
Now suppose we close the subfolders 'Acute' and 'Regular' as well as we close the subcategories 'Acute' and 'Regular':
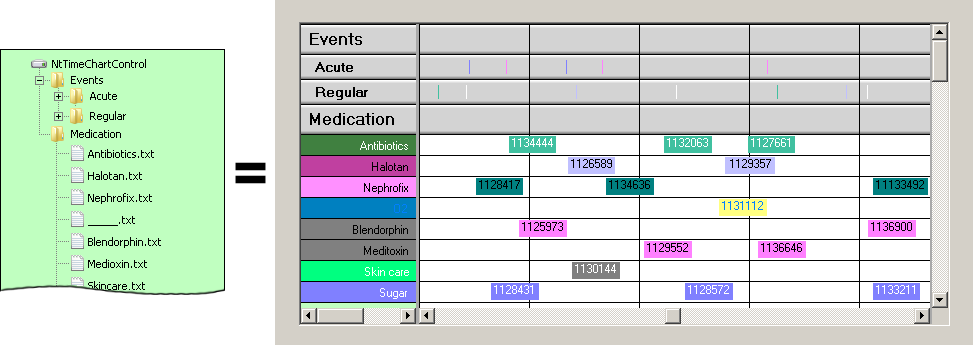
In the folder view the '+' sign indicates that there is something to find in the closed folders. In the Time Chart the small vertical 'category lines' indicate not only that there is data within the closed categories
but even where it is located: For every data object that is now hidden you will find a category line instead.
No we even close the top level folder 'Events' and the top level category 'Events':
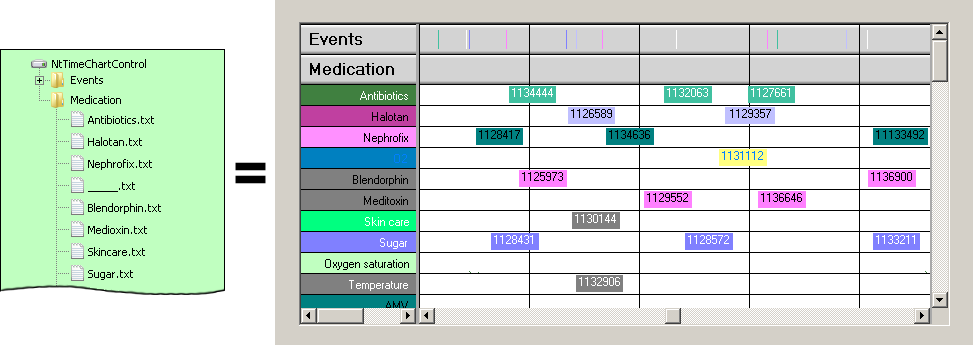
Again the '+' sign indicates the presence of data in the folder and so do the category lines for the category 'Events'.
Please note that the category lines are optional, you can turn them on and off via the boolean property
ntTimeChartControl.ShowLinesOnCategoryRows at any time.
Dragging Categories
Users can reorder categories in the same way as they can reorder rows: By holding Ctrl-key while clicking on a category row within a NtFlankControl (this is the legend typically to the left or the right) they can drag
the category. The category moves completely with all its subcategories and rows in it. It is not possible to devide a category or move rows or subcategories out of their hosting category. This ensures that users
can very well change the order of rows (or categories) within the same hirarchy level but can not change the tree hierarchy itself.
The following screenshot shows a category being dragged along with its rows.
Visual Appearance of Categories
As you can see from the example screen shots, category rows are drawn in grey with a decent 3D effect. Further more they have a category title drawn by a certain font and font size. You can set the fonts for the
various category levels via the
Category titles of minor categories are intended a few pixels compared to titles of higher categories. The amount is defined by
<< Prev.: Custom Drawing Next: Perspectives >>