
Custom Object Drawing
Overview
Besides the built in methods of drawing data objects (icons, images, texts, and crossmark curves) you can implement your own methods of drawing data objects. This section describes how this is done.
Custom Drawing basics
Data is stored in
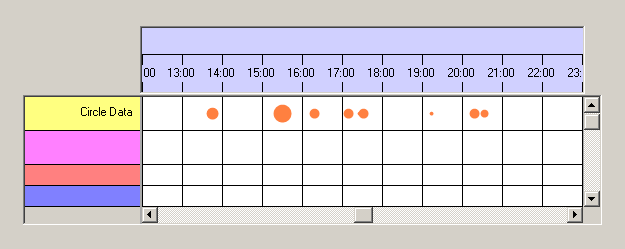
As an example suppose you have data made of floating point values from 0.0 to 1.0 in your data set. The name of these data items shall be 'Circle Data'. Now you decide that you do not want to display this data
as plain text that writes the numbers on the screen. Instead you want to show it in filled circles and the radius of the circle shall display the value of the data object: Radius shall range from one pixel (for
value 0.0) to 10 pixels (for value 1.0). Then your Time Chart might look likt this:
Of course the
So what is the workflow in custom drawing?
Custom drawing consists of the following steps:
- Your application has to implement the interface NtCustomObjectPaint.
- You must instantiate a
NtDisplayDef withdisplayMethod greater 100 and the correctdataTypeId . ThisNtDisplayDef must be added to theNtTimeChartControl by callingSetDisplayDef .
While creating the
- For each data object the
NtTimeChartControl always knows the left and the right edge of the painting rectangle measured in the time unit 'Ticks'. As these edges depend on the size of the visual representation of the object and the object's position in time relative to its time stamp, it is up to your code to calculate these edges for custom drawn objects.
- For data objects that overlap the current sheet the
NtTimeChartControl needs to know the precise position of left and right edge measured in sheet coordinates (which are pixels).
- For data objects that overlap the current sheet the
NtTimeChartControl needs to know the top and bottom in pixels relative to the top of the current row.
- Finally for custom objects the
NtTimeChartControl will call your code to actually do the drawing.
This looks a little complicated at first glance, but in fact it is not too much code to create. Instead of theoretically describing the necessary steps to implement the NtCustomObjectPaint interface, it is better to take a look into the tutorial Custom Object Drawing.
NtDisplayDefs for custom drawn objects
<< Prev.: Display Definitions Next: Categories >>