Display Definitions
Overview
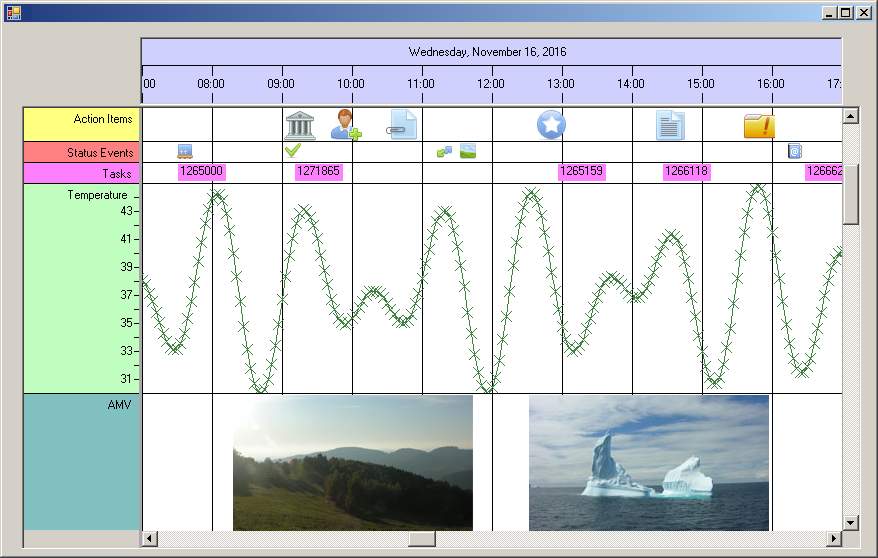
Again take a look on the screenshot below. Different objects are shown in the Time Chart. Objects of same type are being grouped in the same row and are drawn in the same style. In this section we will learn
how the Time Chart determines the style of drawing for each data object.
As described in the chapters before, every data object is stored in a class of type NtDataObject (or subclasses derived from that). Then it was explained that actual drawing is done with the
help of NtDisplayObjects. Display Objects can be of different types like text, crossmarks, icons, images or application defined types (custom drawing). This brings us to two questions:
- How does the Time Chart know what type of display to choose (e.g. text or crossmark)?
- Once the type is known, how are the additional properties defined like colors of the crossmarks or fonts of the texts?
To answer these questions, we take a look onto the base class definition of the data objects:
public class NtDataObject
{
public ulong objId;
public int dataTypeId;
public DateTime dt;
public DateTime dtEnd;
public string text;
}
The interesting field is the integer dataTypeId. Every data object must have this set properly. For example in the screenshot above you can see different data types already (and there
are more in rows currently outside the visible area). One example is 'Temperature' and another is 'Tasks'. It can be seen that currently there are many data objects of type 'Temperature' in sight while only
five of type 'Tasks' can be seen right now.
It is easy to understand that all instances of NtDataObject that hold 'Temperature' values have the same number stored in dataTypeId while all
NtDataObjects holding 'Tasks' have another number. For the upcoming sections pleas assume all 'Temperature' objects have 100 as dataTypeId while all 'Tasks' have
200.
In order to know how to draw the data objects, the NtTimeChartControl needs a set of additional objects: So called NtDisplayDef objects. For each type of
data objects one individual NtDisplayDef is needed. The definition of NtDisplayDef looks like this:
public class NtDisplayDef
{
public int dataTypeId;
public int displayMethod; //Type of display: 1=text, 2=cross, 3=bitmap, 4=icon, above 100=custom drawn
public int preferredRowHeight;
public System.Drawing.Color foreColor;
public System.Drawing.Color textColor;
public System.Drawing.SolidBrush bkBrush;
public System.Drawing.SolidBrush textBrush;
public System.Drawing.SolidBrush foregroundBrush;
public System.Drawing.Pen foregroundPen;
public string rowHeaderStr = "";
public int iconWidth;
public long lineMaxSeconds;
public int lineType;
public int hotspotX;
public int hotspotY;
public int imageHeightLimit;
public int imageWidthLimit;
public int tooltipType;
public double scaleMin, scaleMax;
public int crosshairType;
public NtDisplayDef() { }
public NtDisplayDef(int _dataTypeId, int _preferredRowHeight, string _rowHeaderStr) {...}
}
In this definition you will find several fields defining the appearance of graphics like colors, brushes, and different size and scaling information. Please see the
NtDisplayDef help page for details on the various fields.
The most interesting members of this class are the first two integers: dataTypeId and displayMethod. Whenever the NtTimeChartControl
wants to create a NtDisplayObject for an NtDataObject it looks into its dictionary of NtDisplayDefs and picks the one that hast the same
dataTypeId as the NtDataObject. In our example, if the Time Chart wants to draw a 'Temperature' object, it looks for the NtDisplayDef
with the dataTypeId 100.
From the NtDisplayDef the Time Char reads the displayMethod member which defines how the data object has to be drawn. These are the possible options:
- For displayMethod ranging from 1 to 4 the Time Chart directly can create the NtDisplayObject used for drawing the data object.
The following fits for displayMethod: 1=text, 2=cross, 3=bitmap, 4=icon.
- For displayMethod ranging from 101 to 9999 the Time Chart calls the NtCustomObjectPaint interface members to let the application create an appropriate
NtDisplayObject for the data object. In this case the application recieves the NtDataObject and the NtDisplayDef as parameters
and returns a NtDisplayObject (or a custom defined subclass derived from NtDisplayObject). And when it actually comes to drawing the object, the
Time Chart will call another member of the NtCustomObjectPaint interface to let the application do the actual painting.
In both cases the NtDisplayDef is useful for creating the NtDisplayDef: In case of the built in display methods the information like colors and brushes are directly
used to do the drawing. In case of custom object painting the application's code can also make use of this information to create the NtDisplayObject and later to do the drawing.
Setting up the NtDisplayDefs
When and how are the NtDisplayDefs created?
Obviously the Time Chart needs exactly one NtDisplayDef per data type. And all NtDisplayDefs have to be in place when drawing.
For this reason it makes sense to set up the NtDisplayDefs during initialization of the NtTimeChart or Form. The Load() method suits well
for this kind of action.
Of course you can set all members of each of the NtDisplayDefs manually. But in most cases you will have a database or configuration file where these settings can be configured dynamically.
In the application code you will then implement the necessary means to load those configurations and create the appropriate NtDisplayDefs on startup. The final step then is to add each of the
NtDisplayDefs to the NtTimeChartControl by calling its SetDisplayDef method.
Please see the Tutorials for various small examples on how to cretate the NtDisplayDefs either manually or from a config file.
NtDisplayDefs for custom drawn objects
Suppose you want to implement your own method for drawing the 'Temperature' values in the example above. This is called 'Custom Drawing'. To keep it simple we assume you want to draw the temperature cross marks
in two different colors: One color for values below 50 degree and another color for values 50 and above. While the NtDisplayDef contains only one definition for a foreground color you now
need two.
So here is what you do: You define a subclass derived from NtDisplayDef that contains all additional information you need:
public class TemperatureDisplayDef : NtDisplayDef
{
public System.Drawing.Color highTempColor;
public System.Drawing.Color lowTempColor;
}
This class contains all fields of NtDisplayDef plus your two colors. For all other data types you create the NtDisplayDefs as usual while for 'Temperature'
you create an instance of your class, set its dataTypeId to 100 and its displayMethod to something greater 100 (110 e.g). Finally you store your instance of
TemperatureDisplayDef to the NtTimeChartControl by calling SetDisplayDef.
Later when it comes to drawing of data objects, the NtTimeChartControl will call your implementation code of the NtCustomObjectPaint interface passing
a reference to the temperature data object and your TemperatureDisplayDef instance. From the latter one you can read the displayMethod and as that will be 110 you
know that it is your own method of drawing data in different colors depending on the value.
The next section will give additional detail on custom drawing.
<< Prev.: Data Display
Next: Custom Object Drawing >>
