
Data Display
Overview
The data contained in the NtTimeChartControl has to be displayed somehow. And as described in the previous chapter, data is stored in separate NtDataObjects with an individual time stamp each.
This chapter describes how the data objects are being drawn in their individual way and on exactly their individual position in time.
Taking a look on the screenshot below, severals objects can be seen spread over the visible range of time in the chart.
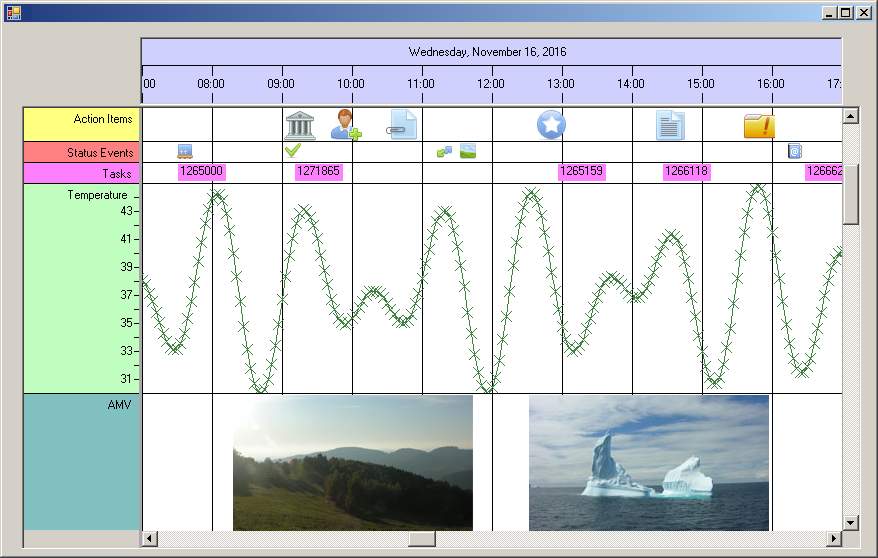
A few things are worth mentioning:
- There are different methods of showing information: Icons, texts, crossmarks in curves, and images.
- Objects of the same kind are arranged in the same row: There are icons in the first and second row, texts in the third, then a courve and finally images.
- It is impossible to see behind the scene to find out what the data structure behind each of the various objects is.
- Still one information can be seen from each of the objects: The time stamp.
Preparing to draw
When is data visible? Please take a look on the image above. It shows Wednesday, November 16 in 2016, 7:00 am to 5:00 pm. So if an object has its time stamp in this time area it is reasonably being shown in this
time range. And even if it takes place at 4:45 pm and is represented by a larger image, this image probably will be shown at least partially.
In terms of the NtTimeChartControl a data object is called 'visible' if you can either see it (at least partially) or if you can make it visible by scrolling once to the left or right within the current scroll
range. In other words a NtDataObject is said to be visible if its visual representation overlaps with the current sheet of the NtTimeChartControl (for the term 'sheet' please see
The Data Sheet Concept a few pages back).
In the chapter Ticks and Pixels you learned how the Time Chart determines if the visual representation of a certain data object
overlaps the sheet.
For each data object intercepting the current sheet the NtTimeChartControl creates another object called NtDisplayObject.
Example:
Suppose your data set consist of 25,000 data items spread over ten years. Suppose your current sheet is ten days long and 80 data objecs fall into its range. But as the client area of your control
is even smaller (e.g. 2 days), there are only 16 items you can actually see.
If the user scrolls left and right, the others might come into view. Please remember the figure about the sheet:
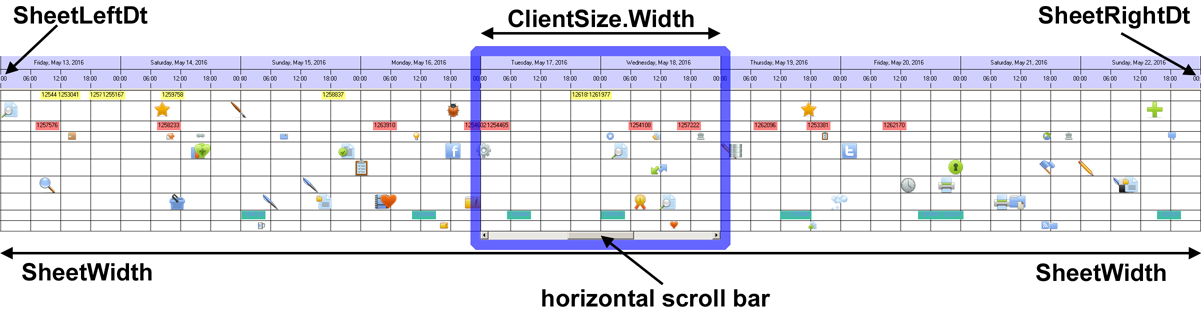
In this situation the Time Chart creates 80 NtDisplayObjects, from which you can see only 16, but you can bring the other 64 into view by scrolling left and right.
And if you scroll to the end of the scroll range and thereby initiate a repositioning of the sheet, the Time Chart will delete the 80 NtDisplayObjects and create new ones depending on the new position of the sheet.
The message is that you have far less NtDisplayObjects than NtDataObjects which is important for performance.
The class NtDisplayObject
The conclusion from the section above is that we have two classes to think about:
1. The class
2. The class
The
Why do we need the additional class NtDisplayObject at all?
The Time Chart may contain millions of data objects. This is possible because data objects are pretty small. But the information needed to actually display the data (like rendering information, bitmaps etc.) is
much bigger. If this would be appended to the data objects themselves the memory would be filled with useless information, because only a very limited subset of data objects is normally visible at a time.
For this reason the separation of data and drawing is key to efficiency.
Further more do not forget that the application might work with even more data objects than stored in the Time Chart. Think of an application that loads 3 million data items from a data base but puts only 1 million
of them to the Time Chart. The others need to be stored as well and it would be inefficient to store them in a data type that is enlarged for potential display. Instead it makes more sense to store them in a
simple data type that can directly be pushed into the Time Chart.
Why do programmers need to know about NtDisplayObjects?
The
The next chapter will explain how the
<< Prev.: Data Objects Next: Display Definitions >>