
NtDisplayDef.lineMaxSeconds Member
For certain types of data a display by a curved plot makes sense. For example in a medical application the patient's temperature shall be drawn as a plot of automatically recorded samples connected by a line.
In a case like this it makes sense to connect one sample with the next only, if the time inbetween is not too long. If the patient is being recorded on intensive care unit, users want to see a contineous plot.
But if the patent is at home for a long time, then returns back to the clinic and his file is being continued, it does not make sense to connect the last sample of his first visit with the first sample of
his second visit.
In other words, connecting dots of a plot only makes sense if the time distance between them is below an arbitrary limit. You can define this limit for each data type via the
NtDisplayDef for that data type. It is this member
The example image below shows a situation like this: Temperature values are being recorded all 3 minutes. In this example
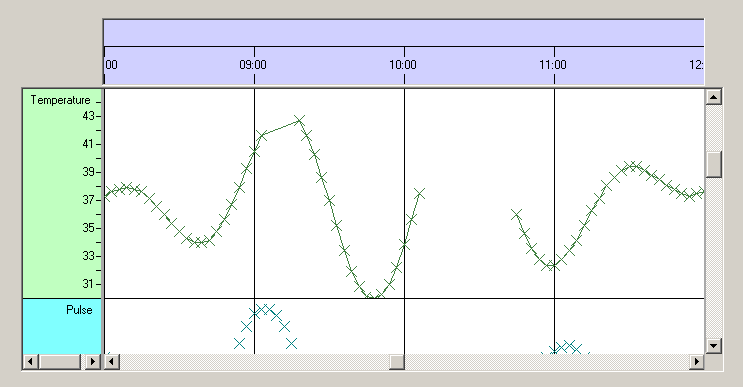
For some applications this
Type:
Remarks:
None.
See also: