
NtDisplayDef.lineType Member
The way how lines between objects are being drawn is being controlled by the
0: No line drawn at all.
1: A slope line from point to point.
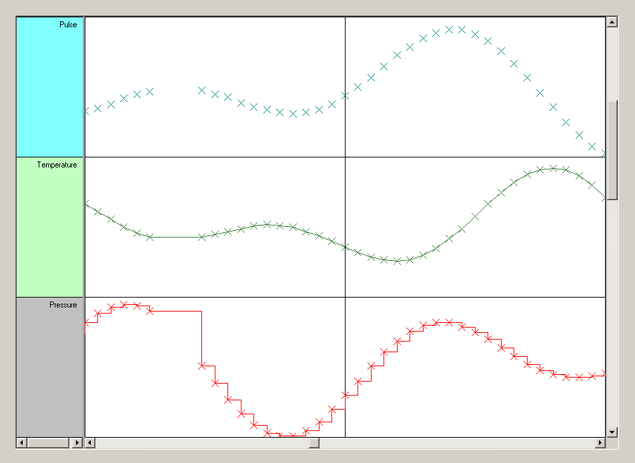
2: A line consisting of two segments: A horizontal one from the first data point up to the X coordinate of the second one and then a vertical one to the second data point.
The third option with the segmented line often makes sense whenever a parameter is said to remain constant until a new value is known. This makes sense when linear interpolation is not suitable. This happens often
when the paramter can have specific values only but not fractions between. For example if you draw a curve (with one data sample per day) of items deliverd: You can not have 7.4 items delivered so interpolation does
not make sense.
Please see an example below for the two different types of curves:
Type:
Remarks:
None.
See also: