
NtDisplayDef.scaleMin Member
When the displayMethod member of a data type's NtDisplayDef is set to 2, this data type is being drawn as a
curve. In this case a vertical scaling is needed. For example if you want to scale a temperature curve in a way that 0 degrees are at the bottom of the Time Chart's row of temperature while 100 degrees hit
the top, then you need an appropriate scaling.
Please take a look onto the example below:
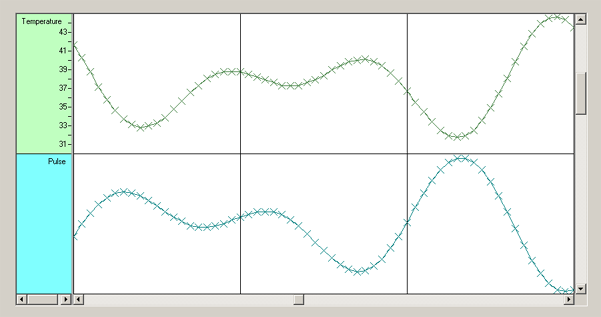
Please note that the scale on the Row Header is created by setting up a bitmap. The actual data values may be completely different. The NtDisplayDef for the data type
controls how data is being scaled: If the values actually are representing the temperature, then the settings of the NtDisplayDef should be
Now assume the pulse courve shall hit the bottom of the pulse row if the acutal pulse is 50 while it should hit the row top if the pulse is 180. Then the members of the
NtDisplayDef should be
Type:
Remarks:
In the NtTimeChartControl data is always stored in objecst of typle NtDataObject or any derivates
you create. When setting displayMethod to 2 for curves, the NtTimeChartControl only
evaluates the NtDataObject's text member and parses it as a floating point number. The vertical position is then
interpolated between the NtDisplayDef's
It is no problem to have values that exeed the limits of this row. The plot will be clipped accoringly.
See also: