
NtDisplayDef.displayMethod Member
The
- No display, the data will not be shown at all. In general this is not the preferred method of hiding data. Rather use the NtPerspective to totally hide data from the display.
- Text
- Curve of nummeric values with crossmarks
- Bitmaps
- Icons
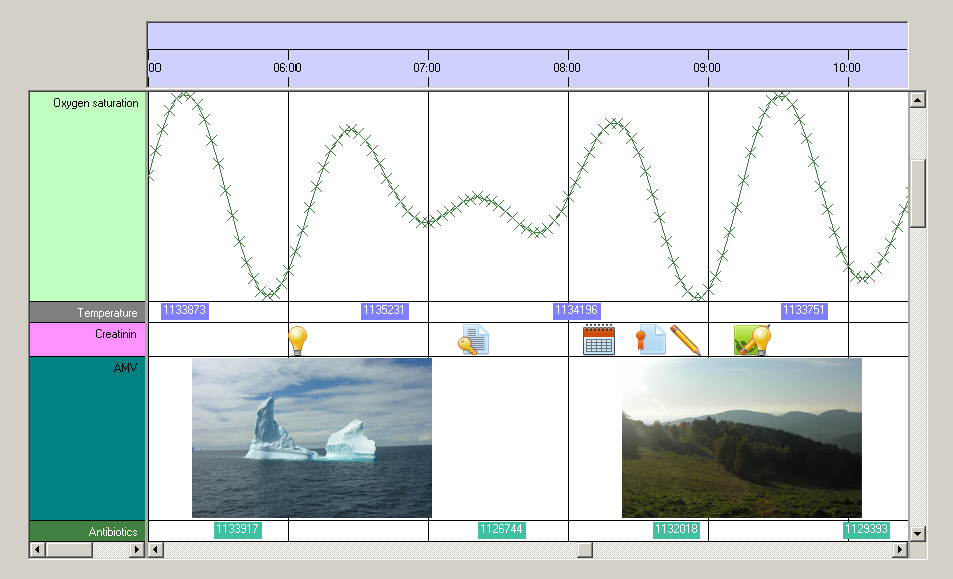
The image below shows the different ways of drawing data. Curve, text, icon, and bitmap.
These methods of display are supported by the NtTimeChartControl by default. But it is fairly easy to create own methods of drawing data objects. In short this is done in the following steps:
- When creating the NtDisplayDefs for the data types you want to draw by yourself,
provide a number greater than 100 as
displayMethod . For each drawing method you want to implement, choose another number (example: circles: 101, squares 102, vertial lines 103, ...). - Let your application or Form implement the interface NtCustomObjectPaint. For each object which is thereby defined to be drawn as custom, the NtTimeChartControl will call your implementing method. Your implementing method will receive as parameters all information you need to do the drawing on your own (including Graphics object, rectangles, object to draw etc.).
The good thing about this technique is that you do not need to bother about the sophisticated mechanisms of covering huge time scales, time scale factors, scroll positions, row and object dragging, clipping etc.
The NtTimeChartControl's framework covers this and provides the appropriate information via the interface.
Please see the tutorial Custom Object Drawing on how to do this in detail.
Type:
Remarks:
This value should be set upon initinalization and not be changed any more.
To switch to your own drawing of objects (so called custom drawing), set this value to anything greater than 100 as 0 to 100 are reserved by the NtTimeChartControl
for other purposes.
See also: