Nateo Concept: Curve Plots
Plotting Curves
When setting up the drawing method for a certain data type by defining the appropriate NtDisplayDef you can set the displayMethod to 2. This will cause the
NtTimeChartControl to interpret the text value of each of the data objects as floating point number, scale it according to NtDisplayDef.scaleMin and
NtDisplayDef.scaleMax and position the data object accordingly in the Time Chart's row.
If in this case the NtDisplayDef.lineType is set to 1 or 2 a connecting line is drawn between two neighboring data objects if their time difference is below a certain limit given by
NtDisplayDef.lineMaxSeconds.
The following image shows examples for three plots: One without lines (lineType = 0), one with connecting lines (lineType = 1) and one with step function connections
(lineType = 2).
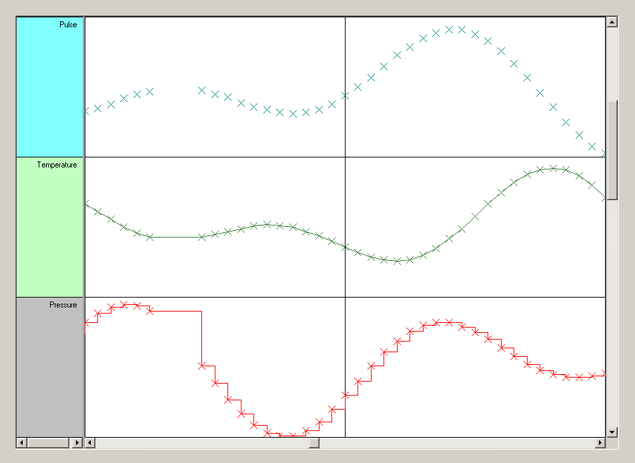
As the difference between the samples is always below the NtDisplayDef.lineMaxSeconds values, the lines are always drawn. In the example below this is different:
Temperature values are being recorded all 3 minutes. lineMaxSeconds is set to 1800 seconds (30 minutes). Shortly after
09:00 am a few samples are missing but the next sample follows before the 30 mins are over so the curve is connected. Shortly after 10:00 am several samples are missing and the 30 mins are exeeded so the curve
is interrupted here.
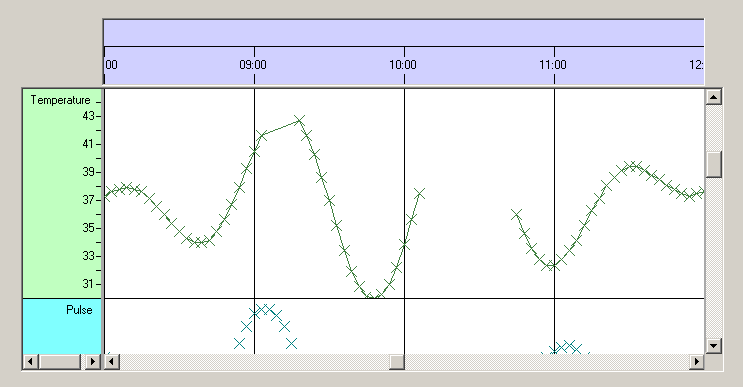
As you can see lineMaxSeconds defines the maximum time distance (in seconds) a line between two dots of a curve can bridge.
Defining the cross size
The actual data points of the curve are NtDataObjects (or derivates) each. The cross mark in the curve indicates the time stamp and the value not with its top left corner but with its center. So obviously in contrast
to typical display objects the cross marks have their so called 'hot spot' located in their center. So the hot spot is defined by half of the cross' size. Vice versa: The cross size is always twice the hot spot
location. For this reason the cross size can be defined via the NtDisplayDef's hotspotX and hotspotY members. In other words, to define the
cross size of your curve you need to set the NtDisplayDef's hotspotX and hotspotY accoringly. A good value is 5, so the cross size will be 10.
Once again stressing this:
Important: To define the cross size for a curve you need to set the NtDisplayDef's hotspotX and hotspotY to the half of the desired
cross size and both values must be the same.
Drawing plots your own way
The way the NtTimeChartControl draws plots offers only some possible options. In case you need your own specific way of plotting data, you can make use of the custom drawing capabilities of
the NtTimeChartControl.
In this case it might be a good hint to create the NtDataObjects in a way that they do not only contain the actual data sample but also a reference to the one before so whenever you obtain
a data object you always can refer to the one before to calculate the line parameters. Further more it could be good to create the NtDisplayObjects in a way that they do not only
contain the data representation itself (e.g. a circle, crossmark etc.) but also the connecting line to the object before (if any). Doing so will ensure that the line will always be drawn correctly because the only
thing you need to do is to implement the drawing of the NtDisplayObject in a way that it draws the object itself plus the line to the one before.
The trick to solve such a task is to precalculate things like line ends in a smart way when creating the NtDisplayObjects to make the actual render process as performant as possible.
Just as a reminder: You create NtDisplayObjects in your code that implements the NtCustomObjectPaint.NtCreateDisplayObject() interface method and you do the
actual painting in your code that implements the NtCustomObjectPaint.NtPaintCustomObject() interface method. Please see
Custom Object Drawing Concept for more details.
<< Prev.: Bitmaps and Icons
Next: Tooltips >>
